Ask Question, Ask an Expert

+61-413 786 465

info@mywordsolution.com

Ask Programming Language Expert

a) Open SAS. In the editor window type the commands below and save this as ass3.sas in your H:\stats301\A3 directory (if this doesn't exist then create it!):

/* This is the STATS301 start up file */

*Set up title on line 1;

TITLE1 "STATS 301: &sysuserid";

*Specify SAS library for storing permanent SAS datasets; LIBNAME stats301 "H:\stats301\A3";

The TITLE1 command his will ensure that your user ID is on all relevant output - if it is not present students will receive NO MARKS for all work. The LIBNAME statement allows you to save permanent copies of ay data sets you create.

In the following we wish to take you from a specific task to a general solution by identifying the general features that can be transferred across similar enquiries. In particular, we want to automate the production of ‘nice' (.rtf) output from these enquiries via the use of SAS MACROs.

Q1

(a) In the following, we will be re-visiting the data set Stats20x that you investigated in assignment 1. The following code can be use to produce a table of the sample size (n), average (mean) and standard deviation (s) for a numerical variable (in this example exam score) for each level of a classification/factor (in this case whether the student passed the assignment - pass_assign=yes or no). Run the code below to reproduce the outputted table that you see below it.

Code:

PROC TABULATE DATA = stats20x FORMAT=6.2;
CLASS pass_assign;
VAR Exam;
TABLE pass_assign all ,Exam*(N='sample size' Mean='mean' std='std dev');
TITLE 'Pass assignment versus Exam';
RUN;

Output:
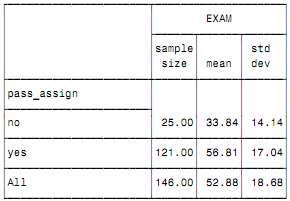
2086_Statistical Programming and Modelling using SAS.png

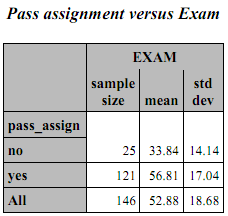
(b) Run this code again except this time make sure you are creating an .rtf file with the in an appropriate folder with this table in it.

Hint: ODS. You should have a suitably named .rtf file that has the following chart placed in it:
67_Statistical Programming and Modelling using SAS1.png

(c) What we would like to do is create similar tables in an .rtf file that produces the same statistics for any numerical value against each level of a know classification/factor from any data set we wish to inspect.

Use MACRO variables to generalise the example above.

To illustrate: in the above code we may decide that the variable Exam can change to any other numerical (e.g. the student test score). So we may generalise this numerical variable -let's call it, ay, y. So we generalise the above code by:

%LET y=Exam; ** we could change this to any other numerical variable e.g. test;

PROC TABULATE DATA = stats20x FORMAT=6.2;
CLASS pass_assign;
VAR &y;
TABLE pass_assign all ,&y*(N='sample size' Mean='mean' std='std dev');
TITLE 'Pass assignment versus Exam';
RUN;

Your task is to create macro variables that allow you to generalise this ODS RTF output to any general data set (found in a suitably named folder) that produces output like the above on a numerical variable for each level of a classification/factor variable. It will need a suitable title.

(d) Hence, create a SAS MACRO that allows you produce the same sort of tables in .rtf format. Produce the MACRO code and illustrate its use by producing 3-4 similar tables for various combinations of numerical and classification variable (One example could be, say, Test versus gender).

Q2

Study the following website on non-linear modelling (as well as the help file for PROC NLIN in SAS);

(a) In no more than one or two paragraphs, and in your own words, (no cut and pasting please) describe how a non-linear model differs from a linear model.

(b) In no more than one or two paragraphs, and in your own words, (no cut and pasting please) describe which components of a non-linear model are the same as for a linear model.

(c) Hence, what criterion is being used to determine the ‘best' estimates?


Attachment:- stats20x.rar

Programming Language, Programming

  • Category:- Programming Language
  • Reference No.:- M9883952

Have any Question?


Related Questions in Programming Language

Overviewthis tasks provides you an opportunity to get

Overview This tasks provides you an opportunity to get feedback on your Learning Summary Report. The Learning Summary Report outlines how the work you have completed demonstrates that you have met all of the unit's learn ...

Question 1 what is a computer program what is structured

Question: 1. What is a Computer program? What is structured programming? 2. What is modular programming? Why we use it? 3. Please evaluate Sin (x) by infinite series. Then write an algorithm to implement it with up to th ...

Question 1 what is hadoop explaining hadoop 2 what is

Question: 1. What is Hadoop (Explaining Hadoop) ? 2. What is HDFS? 3. What is YARN (Yet Another Resource Negotiator)? The response must be typed, single spaced, must be in times new roman font (size 12) and must follow t ...

Assignment task -q1 a the fibonacci numbers are the numbers

Assignment Task - Q1. (a) The Fibonacci numbers are the numbers in the following integer sequence, called the Fibonacci sequence, and are characterised by the fact that every number after the first two is the sum of the ...

Task arrays and structsoverviewin this task you will

Task: Arrays and Structs Overview In this task you will continue to work on the knight database to help Camelot keep track of all of their knights. We can now add a kingdom struct to help work with and manage all of the ...

Task - hand execution of arraysoverviewin this task you

Task - Hand Execution of Arrays Overview In this task you will demonstrate how arrays work by hand executing a number of small code snippets. Instructions Watch the Hand Execution with Arrays video, this shows how to ste ...

Question - create a microsoft word macro using vba visual

Question - Create a Microsoft Word macro using VBA (Visual Basic for Applications). Name the macro "highlight." The macro should highlight every third line of text in a document. (Imagine creating highlighting that will ...

Assignment - horse race meetingthe assignment will assess

Assignment - Horse Race Meeting The Assignment will assess competencies for ICTPRG524 Develop high level object-oriented class specifications. Summary The assignment is to design the classes that are necessary for the ad ...

Structs and enumsoverviewin this task you will create a

Structs and Enums Overview In this task you will create a knight database to help Camelot keep track of all of their knights. Instructions Lets get started. 1. What the topic 5 videos, these will guide you through buildi ...

Assignment - haskell program for regular expression

Assignment - Haskell Program for Regular Expression Matching Your assignment is to modify the slowgrep.hs Haskell program presented in class and the online notes, according to the instructions below. You may carry out th ...

  • 4,153,160 Questions Asked
  • 13,132 Experts
  • 2,558,936 Questions Answered

Ask Experts for help!!

Looking for Assignment Help?

Start excelling in your Courses, Get help with Assignment

Write us your full requirement for evaluation and you will receive response within 20 minutes turnaround time.

Ask Now Help with Problems, Get a Best Answer

Why might a bank avoid the use of interest rate swaps even

Why might a bank avoid the use of interest rate swaps, even when the institution is exposed to significant interest rate

Describe the difference between zero coupon bonds and

Describe the difference between zero coupon bonds and coupon bonds. Under what conditions will a coupon bond sell at a p

Compute the present value of an annuity of 880 per year

Compute the present value of an annuity of $ 880 per year for 16 years, given a discount rate of 6 percent per annum. As

Compute the present value of an 1150 payment made in ten

Compute the present value of an $1,150 payment made in ten years when the discount rate is 12 percent. (Do not round int

Compute the present value of an annuity of 699 per year

Compute the present value of an annuity of $ 699 per year for 19 years, given a discount rate of 6 percent per annum. As