Topic: Power Analysis and Load flow analysis
1. Power Flow
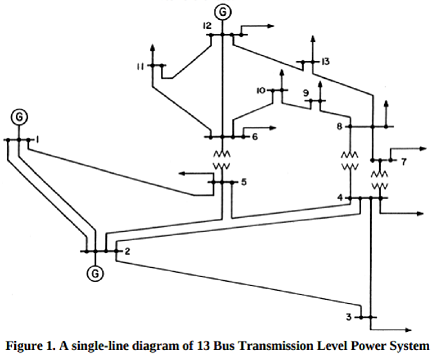
a) A typical 13-bus transmission level power system is shown in Figure 1. Data for this power system is provided in Section 3. Conduct a base case power flow study on the power system, and include a table summarising load flow results in your final report. Obtain the Y-Bus of the system. For data not given, appropriate values should be assumed. Justification of these values should be provided with appropriate references.
b) Compensation:
(i) Identify the lowest voltage bus in the power system by observing the magnitude of voltage levels. Draw a Q-V curve for the identified bus. Include the Q-V curve in your report.
(ii) Mention one method of increasing the voltage magnitude at the lowest voltage bus by 5% from the base case. Demonstrate the effectiveness of this method by making appropriate changes to the input data of the base case and by running the power flow program. Obtain the new Y-bus, compare it with Y-Bus in part (a), and explain the differences. Draw another Q-V curve for the same bus. Compare this Q-V curve with the one obtained in previous part (i). Comment on the results.
c) Impact of Renewable Generation
Add renewable generation sources (wind and photovoltaic PV) at non-generation bus 'L.' (excluding bus 1, 2 and 12) and study their implications on the network voltage profile and reactive power requirements. Note: Replace 'L' with the last digit of your S digit student number (if you work in a group, use any one of the group members' student number). If the last digit is zero/1/2, then use the second last digit. If the second last digit is still zero/112, then continue to find the last feasible digit. In the worst case, choose bus 7.
(i) Add a wind generator with output power = 50 MW, Pmax = 100 MW, Qmax = 40 MVAR and Qmin = -40 MVAR.
(ii) Add a PV generation of 50 MW, which operates at unity power factor. Model the PV as a negative load.
d) Contingency analysis
Does your system (as in Q1-a/base case) have any difficulties with any of the following conditions? Justify your answers by including bar graphs of the system voltage profile for the following cases. Apply one contingency at a time.
(i) If all the loads of your system are increased by 15% without any increase in generation.
(ii) If the generator at bus 2 is out of service due to a sudden failure.
(iii) If the transmission line between bus 2 and bus 3 is out of service for maintenance.
2. Voltage Stability
After doing Q.1, have you ever wondered the maximum loading capability of your transmission network? Bus voltages can collapse when the loading surpasses the maximum capability of the transmission network. This is called voltage stability or PV analysis. Use base case power flow you have developed, do PV analysis by increasing all loads and all generators' outputs until reaching voltage collapse point. Include the PV curve in your report. What insights can you get from the PV curve? What is the difference between PV and QV analysis? Based on PV and QV analysis, what conclusion can you draw in terms of voltage control? (If Power World has difficulties to calculate PV curve, you can remove constraints on unit MW limits and tune the calculation step size. You are strongly encouraged to attend the tutorial. Tutor will explain PV analysis and do some demonstrations. Otherwise, please read provided materials in blackboard.)
3. 13-Bus Transmission Level Power System Data
System Base: 100 MVA
(1) Bus Data
|
Bus No.
|
Nominal Voltage
(kV)
|
Type
|
Real Power Loan (MW)
|
Reactive Power
Load (MVAR)
|
|
1
|
138
|
Slack Bus
|
--
|
--
|
|
2
|
138
|
PV
|
--
|
--
|
|
3
|
138
|
PQ
|
95
|
20
|
|
4
|
138
|
PQ
|
45
|
0
|
|
5
|
138
|
PQ
|
10
|
2
|
|
6
|
66
|
PQ
|
11
|
7.5
|
|
7
|
66
|
PQ
|
4xL
|
---
|
|
8
|
66
|
PQ
|
25
|
7
|
|
9
|
66
|
PQ
|
20
|
6
|
|
10
|
66
|
PQ
|
20
|
5
|
|
11
|
66
|
PQ
|
30
|
10
|
|
12
|
66
|
None
|
13.5
|
6
|
|
13
|
66
|
PQ
|
20
|
5
|
(2) Generator Data
|
Bus No.
|
Pmax (MW)
|
V scheduled
|
Qmax (MVAR)
|
Qmin (MVAR)
|
|
1
|
500
|
1.06
|
250
|
-250
|
|
2
|
200
|
1.02
|
100
|
-100
|
|
12
|
200
|
1.01
|
100
|
-100
|
3) Branch Data
|
From
|
To
|
R (pu)
|
X (pu)
|
B (pu)
|
|
Bus 1
|
Bus 2
|
0.01938
|
0.05917
|
0.05280
|
|
Bus 1
|
Bus 5
|
0.05403
|
0.22304
|
0.04920
|
|
Bus 2
|
Bus 3
|
0.04699
|
0.19797
|
0.04380
|
|
Bus 2
|
Bus 4
|
0.05811
|
0.17632
|
0.03400
|
|
Bus 2
|
Bus 5
|
0.05695
|
0.17388
|
0.03460
|
|
Bus 3
|
Bus 4
|
0.06701
|
0.17103
|
0.01280
|
|
Bus 4
|
Bus 5
|
0.01335
|
0.04211
|
0
|
|
Bus 6
|
Bus 10
|
0.09498
|
0.19890
|
0
|
|
Bus 6
|
Bus 11
|
0.12291
|
0.25581
|
0
|
|
Bus 6
|
Bus 12
|
0.06615
|
0.13027
|
0
|
|
Bus 7
|
Bus 8
|
0
|
0.11001
|
0
|
|
Bus 8
|
Bus 9
|
0.03181
|
0.08450
|
0
|
|
Bus 8
|
Bus 13
|
0.12711
|
0.27038
|
0
|
|
Bus 9
|
Bus 10
|
0.08205
|
0.19207
|
0
|
|
Bus 11
|
Bus 12
|
0.02092
|
0.19988
|
|
|
Bus 12
|
Bus 13
|
0.17093
|
0.34802
|
0
|
(4) Transformer Data
|
From
|
To
|
R (pu)
|
X (pu)
|
|
Bus 4
|
Bus 7
|
0
|
0.20912
|
|
Bus 4
|
Bus 8
|
0
|
0.55618
|
|
Bus 5
|
Bus 6
|
0
|
0.25202
|
4. Distribution Network
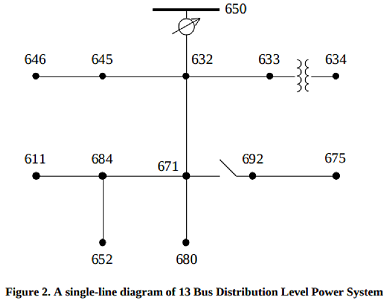
Transmission level power grid is usually meshed to increase its operational security. However, distribution level power grid is often radial. Why is that? A typical 13-bus distribution level power system is shown in Figure 2. Data for this power system is provided in Section 5.
5. 13-Bus Distribution Level Power System Data
System Base 100 MVA
(1) Branch data
|
From Bus No.
|
To Bus No
|
R (p.u.)
|
X (p.m.)
|
B (p.m.)
|
|
632
|
645
|
0.5036
|
0.5103
|
1.12 x 10⁻⁷
|
|
632
|
633
|
0.2851
|
0.4475
|
1.35 x 10⁻⁷
|
|
645
|
646
|
0.3009
|
0.3084
|
0.66 x 10⁻⁷
|
|
684
|
652
|
0.8136
|
0.3105
|
33.71 x 10⁻⁷
|
|
632
|
671
|
0.5114
|
1.5876
|
5.64 x 10⁻⁷
|
|
671
|
684
|
0.3009
|
0.3084
|
0.66 x 10⁻⁷
|
|
671
|
680
|
0.2586
|
0.7839
|
2.67 x 10⁻⁷
|
|
684
|
611
|
0.3021
|
0.3063
|
0.64 x 10⁻⁷
|
|
692
|
675
|
0.3023
|
0.1691
|
0.21 x 10⁻⁷
|
Note that, the switch is on. Node 671 is the same as node 692. You should assume a zero impedance line between 671 and 692. You can assume a very small impedance to model the zero impedance in PowerWorld.
(2) Transformer Data
|
From Bus No
|
To Bus No
|
R (p.u.)
|
X (p.u.)
|
|
650 (66 kV)
|
632 (5 kV)
|
0.01
|
0.08
|
|
633 (5 kV)
|
634 (0.48 kV)
|
0.011
|
0.02
|
(3) Load Data
|
Bus No
|
kW
|
kVAR
|
|
634
|
400
|
290
|
|
645
|
170
|
125
|
|
646
|
230
|
132
|
|
652
|
128
|
86
|
|
671
|
1155
|
660
|
|
675
|
843
|
462
|
|
692
|
170
|
151
|
|
611
|
170
|
80
|
|
680
|
200
|
120
|
(4) Generator Data
A synchronous generator is located at bus 650. Its maximum active power output is 5 MW. Its reactive power range is -4 MVAR to 4 MVAR.
Now, after building the grid, here are your questions.
(a) Conduct a power flow study on the power system and include a table summarizing load flow results in your final report. Obtain the Y-Bus of the system. What is the difference between transmission and distribution network?
(b) Identify the lowest voltage bus in the power system by observing the magnitude of voltage levels. Draw a Q-V curve for the identified bus. Include the Q-V curve in your report. As compared with the QV curve you find in the transmission level study, what is the difference?
(c) Imagine you are an electrical engineer at Energex and your boss asks you to boost the voltage of the lowest voltage bus by 5%, which way is more appealing to customers? Distributed solar panel generation at the same bus (e.g. unity power factor, no VAR allowed?) or a shunt capacitor at the same bus? List the required MW of solar generation and the required MVAR of shunt capacitor in your report.
(d) Do a PV analysis in the same way as Q2. What is your conclusion?
Attachment:- Assignment Files.rar