problem 1: Non-Ideal Gas (van der Waals equation): An equation of state for a non-ideal which is commonly used is the van der Waals equation for 1 mol of gas:
P = (R*T)/(V-b) - a/(V^2)
P = Pressure in Atmospheres
R = 0.0821 Atm*Liters/Mol*Kelvin
T = Temperature in Kelvin
V= Volume (in Liters)
The a and b values are:
Ideal Gas: a = 0, b = 0 (so it reduces to ideal gas equation)
Nitrogen: a = 16.4349 b = 0.0386
Oxygen: a = 16.5896 b = 0.0318
A) For T = 300 K and V = 10L, find out the pressure for nitrogen and oxygen and compare the results with ideal gas
B) Plot the pressure for oxygen & nitrogen for a range of volumes from 0.1L to 10L (in steps of 0.05L) and compare to ideal gas.
C) Plot the ratio of the pressure of nitrogen to oxygen and note what happens as the gas is compressed to about 1 L. At this volume, the partial pressure of nitrogen would be much larger than that of oxygen. This is why a scuba diver must be careful when they dive too deep.
problem 2: Wind Chill Calculation
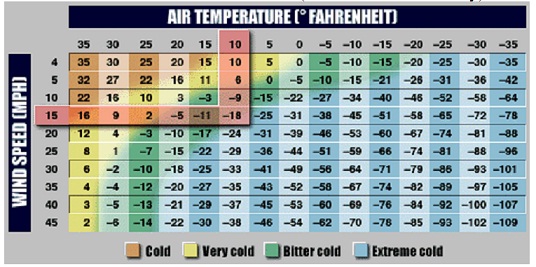
Both the temperature and wind speed combine to give a temperature called the wind chill. The "standard" formula used to find out wind chill (WC), for a given temperature (t, in degrees F) and wind speed (v, in MPH) is
WC = .0817*(3.71 * sqrt(v) + 5.81 -.25*v)*(t-91.4)+91.4
This results in wind chill tables as below (linked from USA Today):
Use Matlab to do the following:
A) find out the wind chill (WC) for a temp & wind speed (and compare it to table to make sure it is correct)
B) What is the result for wind speed < 5 MPH
C) Make plot of WC versus wind speed:
- Make a vector of wind speeds (from 5 - 40 MPH in steps of 5).
- find out WC for these speeds at a given temperature (will need to use array arithmetic).
- Plot curve of WindSpeed versus WC for this temperature.
- find out WC for another temperature & overlay on this graph.
- Label your graph appropriately.
D) Repeat the step above by making a script file which:
- Asks for Temperature.
- Creates a vector of wind speeds (5-40 MPH).
- find outs wind chill at this temp.
- Plots and labels the graph.
E) Repeat the previous plot for speeds of 5 - 200 MPH and note what this means?
F) Make surface plot of WC versus wind speed & temperature:
- Use meshgrid to find out table of WC versus wind speed & temp.
- Plot the surface.
G) Print out WC table after appending on a row of wind speeds and column of temperatures.
H) Print out a subrange from 15-30 MPH.
I) Use the solve command to determine the wind speed needed to give a particular wind chill at a given temperature (or at given wind speed).