Question 1. Manipulate spectral image
Hyperspectral images can be seen as a generalisation of normal colour images such as RGB images. In a normal RGB colour image, there are 3 channels, i.e. channels for red colour, green colour and blue colour. It is normally organised in a 3D array, e.g. an array X of size 100x120x3, for a raster image with 100 pixels in its vertical line and 120 pixels in horizontal line. Then X[ , , 1], the first "slice" of the array which is a matrix, is the matrix containing all red colour information typically ranging from 0 to 1 with 0 meaning totally dark and 1 brightest in terms of red colour presence. Similarly X[ , , 2] is for green and X[ , , 3] for blue. Hyperspectral image (HSI) has similar structure as RGB images. Besides RGB channels, a typical HSI has hundreds other channels (sometimes called bands or wavelengths). R can render an RGB image, so in the same way, HSI can also be displayed as an image but using its RGB channels. Another way to look at HSI is that each pixel in HSI is a spectrum. For example, if X of size 610 340 103 is a 3D array storing an HSI, then there are 103 channels in this HSI and X[2,3,] is a vector of length 103 which is the spectrum at the second row and the third column (imagine an HSI as a cube). Due to the rich information contained in the bands, HSI is usually used to characterise the objects in the image. Each pixel is either a pure material or a mixture of several materials.
Here we will look at this HSI called Pavia University scene remotely sensed by ROSIS sensor. It has 103 channels. Each pixel has been classified manually as one of the 10 classes in the scene which includes a background class. The whole data set and ground truth are packed in a matlab file called paviauni.mat which is in vuws. This is the file you need to work on. You can use readMat() in R package called R.matlab to read in matlab file
library(R.matlab)
A <- readMat('paviauni.mat')
names(A)
[1] "X" "groundtruth"
groundtruth is the classification information of each pixel and X are the actual HSI.
Write R scripts for the following tasks.
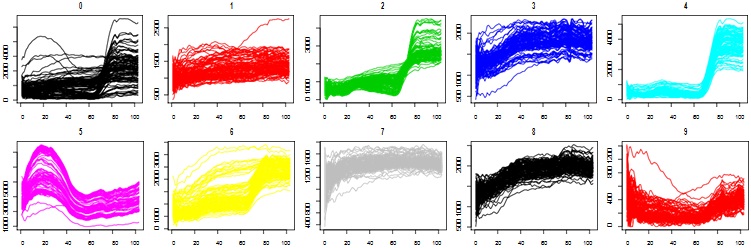
1. Produce a plot of 100 spectra randomly chosen from each class (if a class has less than 100 spectra then take them all) and plot classes in separate subfigures as the following
2. Display Pavia University data set as a colour image using channels 57, 27 and 17 as RGB channels. The function to use is grid.raster() in the package called grid. Note that the values in the image has to be normalised to the range from 0 to 1.
Question 2. Random walks on graph
Simulate random walks on a directed graph. Assume there are N vertices and the connections between vertices are shown in Fig. 1. A random walker can land on any vertex (site). Then he begins to move to the next site along an arrow with the probability written on the arrow. This process repeats for e.g. 1000 times. Note that the walker can stay on the site at next step and the summuation of all outgoing probabilities of any site (arrows pointing outwards to other sites, including arrow pointing to itself) has to be 1. See V1 in Fig. 1 as an example.
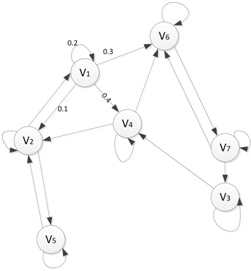
Figure 1: Directed graph. Labelled circles are vertices (sites). Arrows (called edges or links) are showing possible next move. The numbers on arrows are the probabilities that the random walker can move from one site to another.
Create a function for this task and a script file to demonstrate how to use it. There is no restriction on how it should be implemented. The only requirement is the final output should be a vector of the possibilities corresponding to the chance of each site to be visited based on the configuration of the directed graph. So you can design a directed graph and specify the probabilities of the move.
Question 3. Cross validation for ridge regression
Cross validation (CV) is a useful tool for model selection, particularly for the selection of model hyperparameters.
To build a model, one needs training data and test data. On training data, some models can be built. Usually, it is called model training or simply training. While the test data, is the "unseen data" not available for training, that the trained models are applied to and on which models performance indicators are calculated such as mean squared error (MSE), so that the best model can be selected.
The basic idea of CV is to shuffle the data randomly first and then divide it into k partitions. Then reserve one part as test set, and take the rest as training set on which different models can be built. Each of the k parts serves as test set once so that this process is repeated k times. Therefore for one type of model, it can be trained k times, evaluated k times (on test partition) and their performance statistics can be summarised. Finally the best model can be chosen according to the statistics such as the smallest MSE. This is called the k-fold cross validation. The k-fold cross validation process can repeat N times, then it is called k-fold cross validation with repetitions.
We are considering a linear regression model called ridge regression. It is similar to the simple linear regression that we have learnt before. However, ridge regression imposes a constraint on the regression coefficients to make them not "too large". This is controlled by a hyperparameter called lambda in the model. The larger the lambda, the smaller the regression coefficients. We use linearRidge function in the ridge package for ridge regression. Download ridge package if you do not have it yet and check the help page for linearRidge function. A simple use case is shown below.
library(ridge)
library(MASS)
head(Boston,4) # Show some observations in Boston Housing data set
|
crim zn
|
indus
|
chas
|
nox
|
rm
|
age
|
dis
|
rad
|
tax
|
ptratio
|
black
|
|
1 0.00632 18
|
2.31
|
0
|
0.538
|
6.575
|
65.2
|
4.0900
|
1
|
296
|
15.3
|
396.90
|
|
2 0.02731 0
|
7.07
|
0
|
0.469
|
6.421
|
78.9
|
4.9671
|
2
|
242
|
17.8
|
396.90
|
|
3 0.02729 0
|
7.07
|
0
|
0.469
|
7.185
|
61.1
|
4.9671
|
2
|
242
|
17.8
|
392.83
|
|
4 0.03237 0
|
2.18
|
0
|
0.458
|
6.998
|
45.8
|
6.0622
|
3
|
222
|
18.7
|
394.63
|
|
lstat medv
|
|
|
|
|
|
|
|
|
|
|
|
1 4.98 24.0
|
|
|
|
|
|
|
|
|
|
|
|
2 9.14 21.6
|
|
|
|
|
|
|
|
|
|
|
|
3 4.03 34.7
|
|
|
|
|
|
|
|
|
|
|
|
4 2.94 33.4
|
|
|
|
|
|
|
|
|
|
|
|
ridgeregression.model <- linearRidge(medv ~.,data=Boston,lambda=1) ridgeregression.model
|
Call:
linearRidge(formula = medv ~ ., data = Boston, lambda = 1)
(Intercept) crim zn indus chas 21.023352544 -0.059891185 0.017709378 -0.072402885 2.310651531
nox rm age dis rad
-3.922337411 2.875263795 -0.009292774 -0.249729427 -0.004395417
tax ptratio black lstat
-0.002731648 -0.535516506 0.006194224 -0.261367653
In the above example, we use Boston data set, which is contained in MASS package. The response variable is medv component, i.e. the median value of owner-occupied homes in $1000s. Note that the hyperparameter lambda is chosen to be 1, which is totally arbitary. However, what value of lambda is reasonable? CV is the solution.
You need to use k-fold CV to determine the best model in terms of MSE. MSE is defined as
MSE = ∑i=1N(yi - yi^)2/N
where yi is the ith reponse variable in test set, and yˆi is the ith estimation of yi by using the model, which can be computed by using predict(ridgeregression.model,test.data) function, where ridgeregression.model is the model you trained, and test.data is the new data you reserved for testing in CV. The smaller the MSE, the better the model.
Create a function to do k-fold cross validation for ridge regression using the following template:
CV.RidgeRegression <-function(y,X,K=10,repetitions=1,lambdas)
{
# y: the response variable (should be a vector) # X: the predictors (should be a matrix)
# K: the value of k in k-fold CV
# repetitions: the number of repetitions in k-fold CV. # lambdas: a vector of values of lambda to be tested. # ...: Any other input arguments appropriate
# Your code goes from here
# Return output
}
In CV.RidgeRegression() function, you need to provide the following functionalities: 1.Save the input data, i.e. y and X into file;
2. Save models (hyperparameters) and indices of training and test data set into file;
3. Display validation process, e.g. which fold it is running, MSE, lambda value, summary statistics of the
MSE values for one lambda value (mean will be sufficient) and so on, similar to the following;
|
MSE lambda
|
|
Run
|
1 Fold
|
1 40.76059
|
1
|
|
Run
|
1 Fold
|
2 29.01013
|
1
|
|
Run
|
1 Fold
|
3 32.58421
|
1
|
|
Run
|
1 Fold
|
4 24.39025
|
1
|
|
Run
|
2 Fold
|
1 26.14238
|
1
|
|
Run
|
2 Fold
|
2 23.01231
|
1
|
|
Run
|
2 Fold
|
3 30.73557
|
1
|
|
Run
|
2 Fold
|
4 48.18946
|
1
|
|
Mean of MSE is 31.85311 for
MSE lambda
|
|
Run
|
1 Fold
|
1 35.86531
|
2
|
|
Run
|
1 Fold
|
2 55.07175
|
2
|
|
Run
|
1 Fold
|
3 26.77029
|
2
|
|
Run
|
1 Fold
|
4 37.20461
|
2
|
|
Run
|
2 Fold
|
1 47.18468
|
2
|
|
Run
|
2 Fold
|
2 29.57044
|
2
|
| Run |
2 Fold |
3 29.12745 |
2 |
| Run |
2 Fold |
4 46.97892 |
2 |
Mean of MSE is 38.47168 for lambda = 2
The best model is when lambda = 1
4. Plot the prediction of the best model against the response with all the data with proper labels such as title, axes labels, legends and so on;
Ridge Regression with lambda = 1
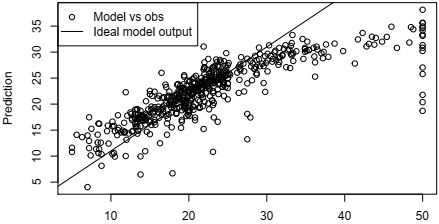
Observed Median Value
The code to produce the above plot is
yhat <- predict(bestmodel,Boston[,1:13]) plot(Boston$medv,yhat,xlab='Observed Median Value',ylab='Prediction',
main=paste('Ridge Regression with lambda =',fl))
abline(coef=c(1,1))
legend('topleft',c('Model vs obs','Ideal model output'),lty=c(NA,1),pch=c(1,NA))
You need to plug in the best model you selected from CV as bestmodel in the above code.
5. Return a list of things such as models generated and their MSE's, best model which corresponds to the minimum MSE, MSE of applying the best model to the whole data set, and anything else that is relevant.
Create a simple document to report on this function using RMarkdown. In this report, you need cover the following topics:
1. Explain the purpose of this function; 2.Explain how it is implemented;
3. Explain the input/output arguments and the usage of the function;
4. Explain behaviour of this function such as save data to file, screen output and so on;
5. Include a show case using Boston data set with actual output of your function and plots; Something like this
cvresults <- CV.RidgeRegression(Boston$medv,Boston[setdiff(names(Boston),'medv')], K=10,repetitions=2,lambdas=seq(0,2,1))
with all its outputs.
6. Any issues with the function.
The idea for this report is to provide a guidance to users like a user manual.