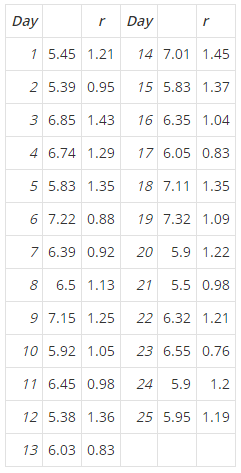
Question: 1. The copper content of a plating bath is measured three times per day, and the results are reported in ppm. Theand r values for 25 days are shown in the following table:
(a) Using all the data, find trial control limits for and R charts, construct the chart, and plot the data. Is the process in statistical control?
(b) Identify out-of-control points. If necessary, revise your control limits assuming that any samples that plot outside of the control limits can be eliminated.
(c) Given that the specifications are at 6.01.0, estimate the process capability ratio (Cp).