Question: Answer the following questions pertaining to the following graph.
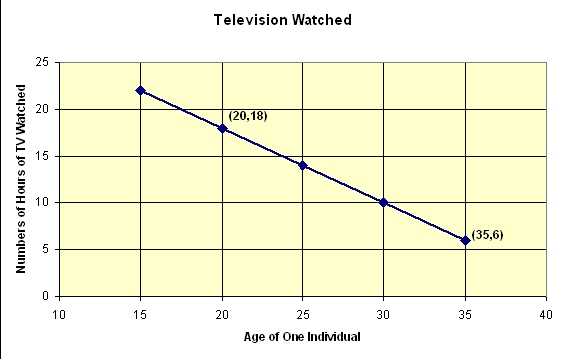
[A] Make a sentence that explains the meaning of the slope within the context of this problem.
[B] At what age was the number of hours of television watched the most?
[C] Estimate the slope of the line. Show your work.
[D] Estimate the equation of the line that represents the number of hours of television watched. Show your work.
[E] Give a brief explanation describing the graph in terms of its x-axis and y-axis.