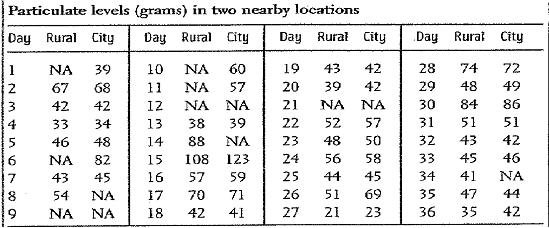
Question: This problem is a study of air pollution. One component of air pollution is airborne particulate matter such as dust and smoke. To measure particulate pollution, a vacuum motor draws air through a filter for 24 hours. Weight the filter at the beginning & end of the period. The weight gained is a measure of a concentration of particles in the air. A study of air pollution made measurements every six days with identical instruments in the center of a small city & at a rural location ten miles southwest of the city. Because the prevailing winds blow from the west, we suspect that the rural readings will be generally lower than the city readings, but that the city readings can be predicted from the rural readings. The table below gives readings taken every six days over a seven month period. The entry NA means that the reading for that date is not available, usually because of equipment failure.
Missing data are common, especially in field studies like this one. We think that equipment failures are not related to pollution levels. If that is true, the missing data do not introduce bias. We can work with the data that are not missing as if they are a random sample of days. We can analyze these data in different ways to answer different questions. For each of the three parts below, do a careful descriptive analysis with graphs & summary statistics & whatever formal inference is called for. Then present & interpret your findings.
We want to assess the level of particulate pollution in the city center. Explain the distribution of city pollution levels, & estimate the mean particulate levels in the city center. [All estimates should include a statistically justified margin of error.]