Question: the table presents data comparing symptom distress {HFSPSTOT - the higher the number, the more distress & functional performance rated 1 to 4 (the higher the number, the lower the function}.
|
Descriptives
|
|
HFSPSTOT
|
|
|
N
|
Mean
|
Std. Deviation
|
Std. Error
|
95% Confidence Interval for Mean
|
Minimum
|
Maximum
|
|
Lower Bound
|
Upper Bound
|
|
1
|
1
|
10.00
|
|
>/td>
|
|
|
10
|
10
|
|
2
|
14
|
12.71
|
6.120
|
1.636
|
9.18
|
16.25
|
6
|
28
|
|
3
|
39
|
18.95
|
7.251
|
1.161
|
16.60
|
21.30
|
6
|
37
|
|
4
|
23
|
25.22
|
8.168
|
1.703
|
21.69
|
28.75
|
11
|
42
|
|
Total
|
77
|
19.57
|
8.469
|
0.965
|
17.65
|
21.49
|
6
|
42
|
|
ANOVA
|
|
HFSPSTOT
|
|
|
Sum of squares
|
df
|
Mean Square
|
F
|
Sig.
|
|
Between Groups
|
1498.190
|
3
|
499.397
|
9.223
|
0.000
|
|
Within Groups
|
3952.668
|
73
|
54.146
|
|
|
|
Total
|
5450.857
|
76
|
|
|
|
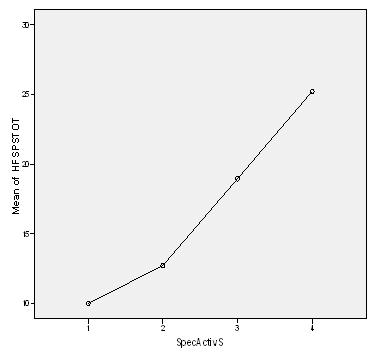
One way Anova - Is there a significant difference in mean symptom distress score [HFSPSTOT] based on functional performance class [Specific activity scale]? Describe your answer to receive full credit.