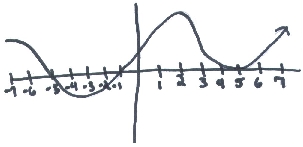
Question: The figure shows the graph of f’, the derivative of the function f for -7 ≤ x ≤ 7. The graph of f; has horizontal lines at x = -3, x = 2 and x = 5, and a vertical tangent at x = 3.
[A] Calculate all values of x where f is increasing.
[B] Calculate all values of x, for -7 ≤ x ≤ 7 at which f attains a relative minimum & maximum.
[C] Calculate all values of x where f’’(x) = 0.