Problem Statement
In this assignment you will estimate the amount of water to transport across the continent using your knowledge of hydrology. You will then use your hydraulics knowledge to design a system to convey this water. Finally, I will ask you to provide a very rough approximation of what it would cost to buy the materials for this project and how much it would cost to operate the pumps. I will also ask you to discuss what you think the environmental consequences of this project might be.
You will transport flood water from the state of Alabama (precipitation = 50-70 in/year) to Tucson and Phoenix (precipitation = 5-10 in/year) (Figure 1). Alabama's water problems are mainly flood and pollution-related, whereas the water problems in and around Tucson are related to over-allocation and decreasing groundwater levels (due to over-extraction of groundwater resources).
Figure 2 outlines the water transfer plan. The water will be transported by closed conduit (pipe) from Alabama to a mountain pass near Seneca, Arizona. Pumps will be required to move the water uphill. At the pass, open conduits (open channels) will be used to transport the water downhill to Tucson. Multiple pipes and channels will be required to transport this large volume of water.
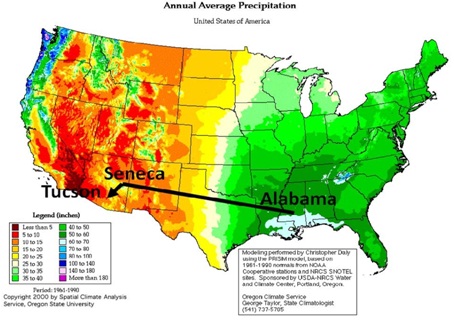
Figure 1. Mean annual precipitation over the United States from the PRISM dataset.
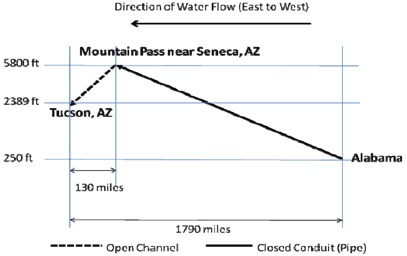
Figure 2. Profile of the conduit plan. (not drawn to scale)
PART 1: HYDROLOGY
Creation of the Unit Hydrograph
On December 2, 1991, a storm took place over the headwaters of Sewee Creek near Huntsville, Alabama. Sewee Creek streamflow observations were made during and following the storm and are given in Table 1.
Table 1. Total streamflow observations following the December 2, 1991, storm on Sewee Creek. (Data obtained from the USGS.)
|
YEAR
|
MONTH
|
DAY
|
HOUR
|
TOTAL STREAMFLOW (cfs)
|
|
1991
|
12
|
2
|
5
|
70.53
|
|
1991
|
12
|
2
|
6
|
75.19
|
|
1991
|
12
|
2
|
7
|
102.76
|
|
1991
|
12
|
2
|
8
|
192.28
|
|
1991
|
12
|
2
|
9
|
442.62
|
|
1991
|
12
|
2
|
10
|
741.61
|
|
1991
|
12
|
2
|
11
|
929.97
|
|
1991
|
12
|
2
|
12
|
588.92
|
|
1991
|
12
|
2
|
13
|
261.20
|
Step 1. Locate the rainfall data for this particular storm using the provided spreadsheet of rainfall values for Huntsville, AL (download it from Blackboard). You will find that it was a 5-hour storm. Record these 5 values in a separate spreadsheet that you will use for all of the work in this final project. Remember that the units are in hundredths of inches, so you will need to divide by 100 to get units in inches.
Step 2. Using the total streamflow data from Table 1 and the rainfall values for the storm, determine the unit hydrograph for this basin. Assume a constant infiltration rate of 0.015 in/hr (based on observations). Assume that there are no other rainfall abstractions. Also, you may assume a constant baseflow of 70 cfs. (Hint: All of the values in the unit hydrograph are whole numbers. Therefore if any of your calculated unit hydrograph values are fractions, this is an indication that you have made a mistake. However, you should know that in reality the unit hydrograph is not comprised of whole numbers. I adjusted the USGS streamflow observations to cause the unit hydrograph ordinates to be whole numbers.) Make a table in your report for the unit hydrograph numbers.
Determination of the Design Storm
Your design storm will be the 2-year 6-hour storm.
Step 1. Using the Huntsville, Alabama, precipitation data that I provided you on Blackboard, calculate the rainfall intensity for the design storm. Also, calculate the probability that a storm of this intensity and duration will occur in any given year. Give these values in your report.
Step 2. Locate the hourly rainfall amounts for this 2-year 6-hour storm, i.e. you need to find the 6 values for this storm from the original hourly rainfall data that I provided you. Record these values in your spreadsheet as well as in your report. Remember to convert the units to inches by dividing by 100.
Calculation of Total Streamflow for the Design Storm
Step 1. For the 2-year 6-hour design storm, determine the total streamflow (direct runoff plus baseflow) in the stream using the six 1-hour rainfall amounts and your unit hydrograph. (Calculate total streamflow at each hourly time step until the total streamflow is equal to only baseflow, i.e. there is no longer any rainfall excess.) As above, you can assume infiltration to be 0.015 in/hr and baseflow to be 70 cfs. (If the rainfall intensities are less than your infiltration rate, than this means that all of the water infiltrates and there is no runoff generation for that hour.) Make a plot of total streamflow and on this plot include the rainfall hyetograph. Include this graph in your report.
Step 2. Determine the peak streamflow for this storm event. We will remove only the top 2% of this streamflow peak for transfer to Tucson (see Figure 3). You can calculate the flow rate for the water to be transported during storm events simply by multiplying the peak streamflow flow rate by 2%.
Step 3. Determine the area of this headwater catchment of Sewee Creek. Report this value in square miles. You will find that this is a fairly small catchment (less than 10 square miles).
Step 4. The volume of flood water from this small catchment alone would not provide enough motivation to build a cross-continental water diversion project. Therefore, we will make the decision that the flood water generated over 0.5% of Alabama's area will be transported to Tucson. The area of the state of Alabama is 84,360 square miles. Calculate the flow rate for 2% of the flood water generated over 0.5% of the state of Alabama due to the 2-year 6-hour storm. (Hint: you can calculate this by taking your flow rate from step 2 and rescaling it by the ratio of the areas, i.e., the ratio of 0.5% of Alabama's area to the area of the small catchment.) Give this total flow rate in your report. This is the flow rate that we will use for hydraulic design purposes.
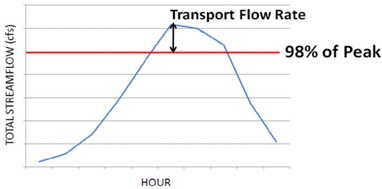
Figure 3. Total streamflow for the 2-year 6-hour design storm. The top 2% of this flow will be transported to Tucson to relieve flooding problems in Alabama and water shortage problems in Tucson. (Hint: you will take the peak flowrate from your total streamflow hydrograph from the design storm and multiply by 2%.) (not drawn to scale)
PART 2: HYDRAULICS
Pipeline Design
You will transport this water (using the total flow rate found above) a distance of 1660 miles from Alabama to the mountain pass near Seneca, Arizona, using a pressured pipe. You may assume a linear increase in elevation. (You may also assume that the total length of the pipes running from Alabama to the mountain pass are 1660 miles because the angle of incline is so small.)
Step 1. Determine the number of 12-foot (yes, I do mean 12-foot, not 12-inch) diameter pipes needed to transport water at this flow rate. For safety reasons, the maximum allowable velocity of water in the pipes is 10 ft/s. For cost efficiency, you will want to select the fewest number of pipes while maintaining velocity less than 10 ft/s. Document the number of needed pipes in your report. Determine the flow rate in just one of these pipes by dividing the total flow rate by the number of pipes. Document this flow rate in your report.
Step 2. For just one of the pipes, develop a system curve with a range that varies from 0 to greater than the flow rate that will be carried in the single pipe. The length of pipe needed is 1660 miles and the static head is 5550 feet (see Figure 2 above). Use smooth concrete and assume that the water temperature is 70 °F. Assume that there are one of each of 3 types of fittings per 10 miles of pipeline. The K's for each of the fittings are 0.15, 0.25, and 0.35. Therefore, for a 10-mile length, the total K is 0.75. What is the total K for the 1660-mile length? Determine the operating point that will be used for the pumping system and place the operating point on the system curve. Include this plot in your report.
Pumping System Design
Now you need to design a pumping system that will be used to transport this very large amount of water. Focus on just one pipe for the design, with the assumption that the same pumping system can be used for each of the pipes.
Step 1. Using pump-flo.com, select a system of pumps that will pump the needed flow rate for one of the pipes. You will need to have pumps in parallel AND in series. In other words, you will have a set of pumps that operate in parallel in each pumping station. The pumping stations will be operated in series along the length of the pipeline (see Figure 4 for an example). You will need to determine how many pumps will be located in the pumping station and how many pumping stations are needed. You will then need to calculate the distance between each pumping station by placing them at equal distances along the pipeline length, i.e., by dividing the pipeline length by the number of required pumping stations. This utilizes the assumption that elevation increases linearly with distance. Document all of your findings in your report along with all of the specifics for your chosen pump. Selecting a pump for your system via pump-flo.com will be largely a matter of trial and error. However, if you do develop a strategy for selecting an appropriate pump, please describe this in your report.
Step 2. Develop an operating strategy that will also allow you to pump flow rates that are smaller than your design flow rate. In other words, you will not always be pumping water at the maximum flow rate, so you need to avoid "burn-out" of your pumps. To do this, show explicitly how your pumping system will handle a flow rate that is only 50% of your design flow rate. Use your system curve to identify the new operating point and state how the pumps will be varied to handle this lower flow rate. Will you need to operate the pumps at a lower speed? Will all of the pumps in a pumping station need to be adjusted or just some of them? Describe your variable flow rate strategy in your report. Remember that if your flow rate changes, your head will change too.
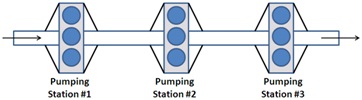
Figure 4. Schematic of pumping stations along the pipeline. Each pumping station contains some number of pumps in parallel (3 pumps are shown for each pumping station in the figure). The pumping stations are placed in series along the pipeline (3 stations are shown in the figure).
Open Channel Design
Once your water reaches the top of the pass near Seneca, you will discharge the water from all of your pipes into open channels. The open channels will then transport the water to Tucson
Step 1. Design a system of channels that will be capable of transporting the entire flow rate. Each channel should be trapezoidal in shape and have the most efficient hydraulic section with the constraint of 2(horizontal):1(vertical) side slopes (for safety purposes). Note that the most efficient section for a trapezoidal channel where side-slope (horizontal:vertical) is constrained to a value of m has the following geometric relationships where A is cross-sectional area, P is the wetted perimeter, b is the bottom width of the channel, and y is the normal depth.
A = y2(2√(1+m2) - m)
P = 2y(2√(1+m2) - m)
b = 2y√(1+m2) - 2my
The maximum top width for any one of the channels is 25 ft. How many channels are needed to transport the total flow rate? For cost-efficiency, you want to build the fewest number of channels while still maintaining a top width less than 25 ft. Report this number of channels. Report this number of channels. Plan to have all of your channels identical with the same flow rate in each. What is the flow rate that will be transported in a single channel? Report this flow rate as well as both the top and bottom widths of the channel.
You will need to calculate the slope of the channel using the numbers in Figure 2. You may assume that Manning's roughness is 0.02.
Step 2. For just one of the channels, do the following:
- Calculate both the normal and critical depths in the channel.
- Indicate whether the flow is subcritical or supercritical.
- Provide a sketch of the channel indicating the channel parameters and the depths on the sketch.
- Provide this information in your report.
Step 3. Calculate what the mean annual evaporation losses will be in this system of channels (in units of in/year). You may use the simple pan evaporation method in which K = 0.7 and Epan = 65 in/yr in Arizona. Discuss how evaporation losses may affect the viability of the project.
PART 3: SYNTHESIS
Costs
Using online resources, provide a very rough approximation of how much it would cost to purchase the materials for this project (pumps, piping, open channel materials). This is to get a very rough order-of-magnitude idea of what the material costs are. You do not need include other costs such as construction costs, permitting costs, policy-related costs, etc... However, you should be aware that the non-material costs are likely to be far greater. You may comment on these other costs if you have the experience and knowledge to do so.
Using online resources, provide a very rough approximation of how much it would cost to operate this system. Include only the energy needed to run the pumps. You do not need to include the cost of personnel wages, etc..., unless you have the experience to comment on these other items.
Environmental Impacts
Discuss the potential environmental impacts of this project from construction through operation and long-term impacts. For example, how might the diversion of huge quantities of water across the continent affect the hydrologic cycle in each of the affected locations? Also, how might the required energy for the project impact the climate?
Loose Ends
In this project, you designed the pipelines, pumps, and open channels to transport water from Alabama to Tucson. What design elements of the project are missing? In other words, if this were a real project, what do you need to design to bring the project to completion? Consider how you will collect the river across all the small tributaries in Alabama and funnel this water into the pipeline system. How will this water be dispersed once it is in Tucson. Where will the water go and how will it go there?
Project Viability
After all of this thought and discussion, do you think this project is realistic? Should it be built? Please describe your reasoning.
PART 4: FINAL SUBMITTAL
For the final submittal you must provide at a minimum:
1. A formal mini-report that describes
a. the problem
b. how each part of the problem was solved
c. the results (including all underlined items in the problem statement above)
d. final recommendations for each component of the system
e. written responses for each of the items in Part 3
f. a list all references where you obtained values and other data
(Note: bullets, subject headings, and tables are good for organizing information)
2. Sample calculations for all work done (including sketches).
3. Printouts of all plots and examples of all of your spreadsheets.
4. A printout of your system curve with the operating point clearly shown (continue on next page...)
5. A schematic of your pumping plan
6. A discussion of how your pumping system will work and how you will operate the system for varying flow rates
7. A datasheet printout for the pump that you selected from the pump-flo.com website
8. Attach example spreadsheets that you created or utilized for this assignment
Finally, you are required to submit a peer and self evaluation if you are working in groups.