Assignment
Experiment: Introduction to the Spectrum Analyzer
Purpose and Discussion
The purpose of this simulation is to demonstrate the characteristics and operation of the Spectrum Analyzer as it applies to radio frequency (RF) communications. The Spectrum Analyzer is one of the most essential testing instruments in the field of communications. To this point, the oscilloscope has been relied upon to analyze AC signals and their relationships to one another. The oscilloscope allows measurements of phase variations between signals as well as period, amplitude and overall signal performance. The time versus amplitude scale, however, does not allow the specific components of a signal to be studied. The Spectrum Analyzer measures signals in the frequency domain, decomposing them into spectral lines at different frequencies.
Ideally, a perfect undistorted sine wave is connected to the input of a Spectrum Analyzer. A single vertical line at its fundamental frequency of oscillation is observed. However, signal sources in the real world are not perfect. They always create some distortion which results in tiny spectral lines. These lines are multiples of the fundamental frequency and are low in amplitude.
Spectral analysis is encouraged in Multisim through use of the Spectrum Analyzer. Multiple duplicate instruments may be utilized for further convenience in the study and testing of AC signals.
Parts
AC Voltage Source
Test Equipment
• Oscilloscope
• Spectrum Analyzer
Formulae
Power in watts
P = Vrms2/ RL Equation 1-1
Procedure
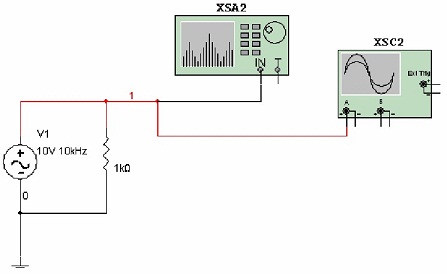
Figure 1-2
1. Connect the circuit illustrated in Figure 1-2.
2. Double-click on the AC Voltage Source. Select the Value tab and set Voltage (Pk) = 10V, Voltage Offset = 0V and Frequency = 1 kHz. Click OK.
3. Double-click on the Oscilloscope. Set the time division to 1 ms/Div and the Amplitude to 5 V/Div. Start the simulation and observe the 1 kHz frequency on the time versus amplitude scale. Stop the simulation.
4. Double-click on the Spectrum Analyzer. Select Set Span under Span Control and Lin under Amplitude. Under Frequency, set the Start and End frequencies. Since we are interested in a frequency of 1 kHz, select Start = 0 Hz and End = 2 kHz.
This will define the frequency settings for the beginning and end of the window, thus centering the 1 kHz frequency. Click Enter to enter the values. This method of setting the Spectrum Analyzer parameters is called the Frequency Control method.
5. Start the simulation. Place the cursor over the vertical marker line and drag the line to the center of the peak of the spectrum shown. Observe the frequency value in the lower-left portion of the window change as the marker is moved. Record the frequency and voltage values in Table 1-1.Verify that the frequency and amplitude values correspond to the AC Voltage Source settings.
6. Stop the simulation. Double-click on the AC Voltage Source and select Voltage Amplitude = 10V and Frequency = 10 kHz.
7. Since the frequency of interest is now 10 kHz, set the Center frequency to 10 kHz. Set Span to 10 kHz. This will designate a total window span of 10 kHz. Click Enter. Notice that the Start and End frequencies are automatically calculated. This technique is called the Span method. Note that one of the two illustrated methods may be used, but not both at once.
8. Start the simulation and move the marker to the left side of the window then the right side of the window, noting that the frequencies at each end correspond to the Start and End frequency settings. In order to obtain the Span setting, subtract the Start frequency from the End frequency. Record your results in Table 1-2. Verify the span setting. Record LIN voltage and mW values as in Step 5, converting the voltage to power in mW using Equation 1-1. Complete Table 1-1.
Expected Outcome
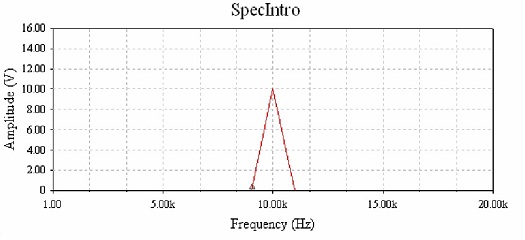
Figure 1-3 Frequency Spectrum of a 1 kHz Signal
Data for Experiment 1
|
Frequency (measured)
|
LIN Voltage (V) (measured)
|
Power (mW) (calculated)
|
Frequency (Hz) (expected)
|
LIN Voltage (V) (expected)
|
|
1 kHz
|
|
|
|
|
|
10 kHz
|
|
|
|
|
Table 1-1
|
Frequency (Hz)
|
Start (Hz)
|
End (Hz)
|
Span (Hz) (measured)
|
Span (Hz) (expected)
|
|
10 kHz
|
|
|
|
|
Table 1-2
Additional Challenge
1. Set the amplitude of the AC Voltage Source in Figure 1-2 to 1 V and the frequency to 10 kHz.
2. Set Span = 10 kHz and Center Frequency = 8 kHz. Click Enter.
3. Verify that the Start and End frequencies are correct for the span and center frequencies selected.