Assignment -
There are two raw data files containing 8-bit two's complement samples taken at the rate of 44,100 samples per second. One is from an audio signal named "xxxxxCleanSig.txt" and the other is from a noisy audio signal named "xxxxxNoisySig.txt" where "xxxxx" represents your last name.
To read in a signal use MATLAB code similar to the following code fragment:
fid = fopen('xxxxxCleanSig.txt','r','b') ;
sig = fread(fid,inf,'int8') ;
fclose(fid) ;
(The file is not really text but I used that extension so you could directly examine it with an editor as ASCII characters.) The file must be in your MATLAB "path" for the fopen command to work. The signals are in the form of a stream of 8-bit bytes and can be converted to double precision numbers in MATLAB by the double command using code similar to the following:
sig = double(sig)/127;
The division by 127 converts from the 8-bit two's complement data range -127 to 127 to the data range -1 to 1. This is the data range expected by the MATLAB command sound. You can use sound to hear your audio signal.
Design a digital filter to remove as much noise as possible from the noisy signal, while at the same time preserving as much of the signal as possible, to make it more intelligible. The random noise is in various frequency bands of various widths at various center frequencies. There is also some broadband random noise. The file xxxxx.txt contains some information about the noise that was added. Report the filter you used as a cascade of first- and second-order digital filter sections. Each first or second order section can described in one of the following forms:
H(z) = A(z+b1/z+a1) or H(z) = A(z2+b1z+b2/z2+a1z+a2)
Report the coefficients of each cascaded section of your digital filter in a plain text file of one of the following forms:
|
Section
|
#
|
|
A
|
number
|
|
b1
|
number
|
|
a1
|
number
|
Or
|
Section
|
#
|
|
A
|
number
|
|
b1
|
number
|
|
b2
|
number
|
|
a1
|
number
|
|
a2
|
number
|
where the two columns are separated by a "tab" character, # is a unique sequence number for each section and number is a decimal number, possibly with a power of 10 in the "E" format used in computers. Here is an example text file for three cascaded sections, one first order and two second order.
Section 1
A 13
b1 0
b2 1.5
a1 4
a2 19
Section 2
A -5E2
b1 -11
a1 2e3
Section 3
A 233
b1 0.2
b2 1.2
a1 -0.65
a2 0.98
One could really go wild with a huge number of filter sections in a attempt to do the best possible filtering. So in your digital filter design observe the limit
(number of 1st order sections) + (number of 2nd order sections) × 2 < 16.
After you have filtered your noisy signal, send it back to me by e-mail in a file consisting only of the 8-bit data sample values in a bit stream. First scale your filtered signal to fill the range -1 to +1. Then you can convert from double precision to 8-bit two's complement integers using code similar to sigf = int8(sigf*127);
You can use code similar to the following to save the bit stream to file:
fid = fopen('xxxxxFilteredNoisySignal.txt','w','b') ;
fwrite(fid,sigf,'int8') ;
fclose(fid) ;
where "xxxxx" again is your last name.
Also include in your report the following:
1. A graph of the original clean signal vs. discrete-time over its full time range.
2. A graph of the noisy signal before filtering vs. discrete-time over its full time range.
3. A graph of the noisy signal after filtering vs. discrete-time over its full time range.
4. A graph of the power spectral density of the original clean signal vs. discrete-time radian frequency Ω over the frequency range 0 < Ω <1. (Power spectral density is defined below.)
5. A graph of the power spectral density of the noisy signal before being filtered vs. discrete-time radian frequency Ω over the frequency range 0 < Ω <1.
6. A graph of the power spectral density of the noisy signal after being filtered vs. discrete-time radian frequency Ω over the frequency range 0 < Ω <1.
7. Graphs of the magnitude and phase of the frequency response of your overall digital filter vs. discrete-time radian frequency Ω over the frequency range 0 < Ω <1. (Warning: I had some trouble using freqz in MATLAB to compute the frequency response of higher-order filters. I had to write my own frequency response function to get a good graph. You may have to do the same. See example code below.)
8. A graph of the cross correlation between the original clean signal and the filtered noisy signal for 0 ≤ m < N/2 and a second graph of cross correlation for 0 ≤ m <10mmax where mmax is the shift for maximum cross correlation. (Cross correlation is defined below.) Ideally those two signals would be identical but that is impossible in reality. Call the clean original signal x and the filtered noisy signal y. Find the shift m for maximum cross correlation between x and y. Remove the first m samples of y, leaving N-m samples. Remove the last m samples of x. Now both x and y have N-m samples. Compute the correlation coefficient between the new x and the new y,
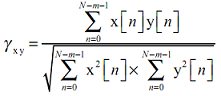
and report this number in your report. A correlation coefficient of one would indicate that the filtering was perfect and that the original signal and the filtered noisy signal looked exactly alike. That is, that the filter removed all the noise and kept all the original signal. This is impossible. A correlation coefficient of zero would indicate that there is no similarity between the original signal and the filtered noisy signal. Typical correlation coefficients will be between 0.4 and 0.7. The exact value depends on the nature of the original signal and the added noise. In your parameter file I have given you a correlation coefficient that I computed for your original signal and a filtering of your noisy signal. My filtering is based on a fairly simple algorithm. You can probably do a little better.
Attachment:- Assignment Files.rar