Problem 1 - Your business relies on the reliable operation of modem-routers for internet connection in remote locations. You have recently opened 2 locations in a rural area of Western Maryland. Problems with the operation of the modem-routers have been persistent and your manager of operations has suggested that you should select one of the locations-- the one with the best up-time (fewest outages) in internet service-- and shut the other location down. A quick decision is needed on the choice of the location to retain. The operations manager suggests that records be kept for the next 50 days of operation and the decision should be based on a "significant difference" in performance. The table shows the number of times during a day when the modem-router had to be reset remotely-- e.g. Day 17 at location 1 there were 6 resets. It appears that Location 2 has more resets of the equipment. The manager points out that the measure of interest in a day is not the number of resets, but, whether or not a reset was performed, regardless of the quantity. This means that whether a reset in a day was 1 or 7, the results are the same--a reset occurred. Perform a 1 tail test of hypothesis at the 0.05 level and determine if the proportion of days that had a (any resets--1, 2, 3 etc.) reset is significantly higher at Location 2 than Location 1. Use Excel Data Analysis package or Minitab for you test.
1) Is there a significant difference in the outages between sites?
2) State how you make your decision (what evidence from the test leads you to make your decision). Place the output from the test in the area provided.
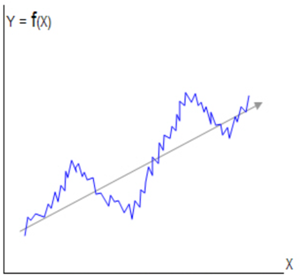
Problem 2 - A manager for a product, Y, believes that the time series sales data for product shows cyclicality and trend. The data is presented as units sold over 13 four week increments; thus, 78 observations represent 6 years of data. A graph the time series should reveal somewhat systematic behavior over 6 cycles, starting in period 1 and ending in period 78. Fit a linear Trendline to the graph where X is the time period and Y units sold.
1) Create a time series line graph with a linear Trendline.
2) Using the linear Trendline, how does Y vary as X varies? (In other words, a unit increase in X leads to what increase/decrease in Y.)
3) Obviously, a linear Trendline will not fit cyclical data perfectly. The hope is that the Trendline tracks the linear trend in the data, and if the linear equation is to used as a predictive tool, it is desirable that there not be prolonged periods of bias in the prediction (high or low bias for long periods of time). Is there a cycle in the data that presents a problem with bias?
Problem 3 - A sales force manager is interested in the effects of training on a group of sales people. She is convinced that training is the key to a successful career in sales. Yet, she also concedes that other factors may be responsible for greater success in sales, for example, education (college or no college). She has compiled some data on 36 sales people that might be able to answer a number of questions. The data includes: 1) scores related to understanding the company's complicated sales process before and after training, 2) the education level of the sales person, and 3) annual sales for the sales person before and after the training. Her trusty assistant, Liliana, suggests that it might be useful to see if there is a relationship between the change in a score after training and the corresponding change in yearly sales. Thus, the data will have to be manipulated slightly; for example, for observation 12, the change in score was +26 (87-61) and the change in sales was +29,133 (268,099-238,986). This suggests that new columns of data will be needed in the table of data. Liliana believes that a simple linear regression is appropriate.
a) Develop a regression model that explains the relationship between Scores and Sales, before and after training. Place the analysis (Excel or Minitab) below. Also, determine the following the regression formula.
b) What is the R2.
c) Do you believe the regression to be effective in relating the movement of Sales due to the movement in Scores on understanding the sales process. Offer a reason why or why not.
Problem 4 - You are developing 4 websites for a firm that advertises to individuals that tend to the Right and Left of the political spectrum. You have interviewed 29 individuals to assess their preferences for 4 websites, as either good or bad. You wonder if there is an association between being either Right or Left leaning (politically) and assessing a site as bad. Develop a contingency table that organizes the Right/Left and bads in the various sites. So, count the joint occurrence of Right/bad and Left/bad for the various sites.
1) Create the contingency table to test for independence of the Right/Left variable and the bads assessed at sites. (Hint: the grand-total of bads should equal 65 and the mechanics of the tables were done in the novice/practice problems)
2) Perform the chi-square test. Is there independence between Political Leaning (Right and Left) and bads for the various sites? Use an alpha of 0.05.
Problem 5 - After a successful career as a data analyst, you decide it is time to "give-back." A friend that runs a not-for-profit educational program for at-risk teens asks you to examine some data and assess the viability of a particular course--Fundamentals of Math. Mastering the concepts taught in this course is deemed an essential life skill. Student data related to two resources that are made available to the teens is collected--1) use of Online help sessions, and 2) E-books viewed by teens. You also have data on the number of classes attended by each student. Data on 40 students is shown in the table, and includes their final grade in the course.
1) Create a regression model that forecasts Final Grade using the resources and attendance. Place the results below. Use either Excel of Minitab (I recommend Excel). Provide the resulting regression model? Assume an alpha of 0.05.
2a) Is the regression formula significant and why?
2b) How much of the variation in Final Grade is explained by the independent variables?
2c) If you were forced to limit your independent variables to only two variables, which would you discard and why?
2d) Predict the score for a student with the following characteristics:
i. received no online help
ii. read 5 books
iii. attended 15 classes
Problem 6 - I have been advised by my doctor to exercise more. Each day I do stomach crunches to strengthen my core...a weak core can be disastrous to your health. I go to the gym twice a day--morning and afternoon. The number of daily crunches I perform are recorded over a monthly period. In the morning I am the only person in the gym; in the afternoon there are many people, and an observant trainer always gives me an inspirational talk as she passes by. One day she asked me if the talk was a transformative moment in my exercise program. I try not to laugh, but then think that I can use an appropriate test of hypothesis to determine the answer to her question. Use the data provided and use a level of significance of 0.05 and do a 2-tail test. (The only difference in my exercise in the a.m. and p.m. is the talk.)
1a) Perform a test to determine if the inspirational talk has made a significant difference in performance. Also, what test did you use?
1b) State the hypothesis for the test.
1c) What is the result--reject or not reject null hypothesis?
Problem 7 - One late Friday afternoon your obnoxious boss comes into your office as you are about to leave, and shows you 26 observations that he believes to be related. Y, he believes, is the dependent variable and X1 is the independent variable. He also thinks there is a 2nd order polynomial relationship in the data (Y = B1X1 +B2X12 + B0), and, as you casually view the data, you tend to agree. He insists that the determination of B1, B2 and B0 is far more important than your Friday afternoon gathering of young-urban-millennial-professionals (YUMPS) at a local watering hole. So, you perform the analysis using the scatter diagram and Trendline tool in Excel. Then you quietly exit for the YUMPS gathering.
Now, it is Monday morning. You want to use the assumption of a 2nd order polynomial to find the exact values of B1, B2 and B0. (Hint: generate a new variable that fits the assumed polynomial model and then use the regression tool in Excel)
1) Use a regression tool in Excel to determine the exact values of B1, B2 and B0.
2) Is the regression model significant? Use alpha 0.05.
Attachment:- Assignment File.rar