Interpreting Statistical Data:
Instructions: Please read through the case scenario presented below to gain an understanding of the background information and the research study. Using the information presented in the case scenario and the tables of data; answer ALL the problems below.
Case Scenario:
Background information:
Talking on a telephone while driving is widely regarded as a risk factor for traffic accidents. Despite legislation in many countries, including Australia, that prohibit the use of handheld mobile phone devices, many drivers continue to use handheld phones for a variety of tasks while driving including talking, sending/receiving text messages, updating Facebook status and playing games.
Prior research has found that talking on a mobile phone while driving changes driving behaviour. There is increased mental workload required to process incoming visual or verbal information via the telephone while simultaneously interpret and appropriately respond to changing traffic conditions that result from traffic management signals (stop signs and traffic lights) and the actions of other drivers. There is also visual distraction when drivers take their attention off the road to view the telephone handset when dialling a telephone number, or reading/writing a text message. Consequently, drivers who talk on hand-held phones tend to slow their driving speeds and those who dial on hands-free phones slow down even more as a way of compensating for the detrimental effects on mental processing.
The research study:
A group of researchers were interested in further investigating the impact of mobile telephone use on car accidents. They began by accessing data from a survey previously sent out in 1997 to approximately 29,000 people who had reported a motor vehicle accident to their insurance company in the previous 12 months. There was a 31% response rate to that survey, with 9150 people returning surveys. Of these surveys, 5007 were complete enough to be used in the study. The researchers replicated the survey a decade later in 2007, sending the same survey out to approximately 33,000 people who had reported a motor vehicle accident in the previous 12 months. They had 6111 surveys returned in 2007, but only 4307 were complete enough to be used in the study.
The surveys in 1997 and 2007 asked the respondents to consider the accident they had been involved in and answer problems regarding their use of mobile phones when driving. Specifically, they were asked: (i) if they were using a mobile phone during (or just before) the accident; (ii) the type of mobile phone (hands free or hand-held); (iii) their gender, (iv) age; (v) number of kilometres driven each year, and the (vi)length of time they had held a drivers’ licence.
Your task:
Information obtained from the 1997 and 2007 surveys is presented in the following tables and figure. Read each carefully and using this information and information presented in the preceding text to answer the problems below.
problem 1: Which of the following best describes the research problem for this study?
a) What are the reasons people drive while talking on a mobile phone?
b) How is driving while talking on a mobile phone associated with the risk of a car accident?
c) What are the costs of mobile-phone related motor vehicle accidents?
d) How effective are hands-free mobile telephones in reducing the annual incidence of car accidents?
problem 2: Which of the following best describes the study design used in this scenario?
a) Longitudinal cohort study
b) Cross-sectional descriptive study
c) Case-control study
d) Non-randomised experimental study
e) Pre-post study
problem 3: What level of evidence does this study design represent?
a) One
b) Two
c) Three
d) Four
e) Five
The researchers used the available survey data to summarise the nature of the car accidents and if a mobile phone was being used by the driver either during (or immediately before) the accident. This information is presented in Table below.
Table: Type of accidents among respondents in 1997 and 2007 who used a mobile phone during (or immediately prior to) the accident, and those who did not.
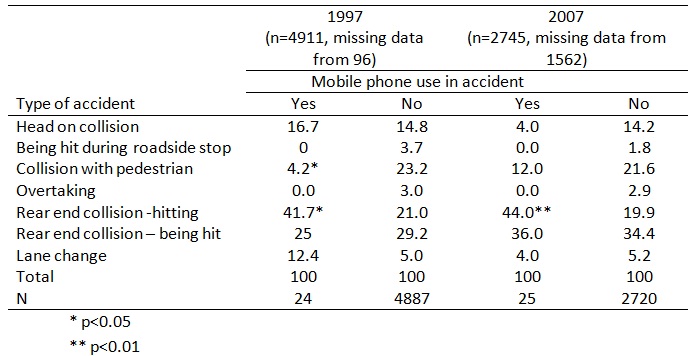
problem 4: Use the data presented in Table above to answer the following problems.
i) What were the total numbers of usable (complete data) survey responses in 1997 and 2007, respectively; that are reported in Table above ?
ii) Using plain language, describe the number of respondents to the 1997 survey that reported using a mobile phone during (or immediately before) the accident? How did this number compare to the 2007 survey respondents?
iii) Identify any ONE threat to the internal validity of the data presented in this table.
The researchers investigated whether people who used a mobile phone while driving had a greater risk of having an accident compared to those who did not use a phone when driving. The relative risks of having an accident when using a hand held phone, using a hands-free phone and using any type of mobile phone when driving are presented in Table below.
Table: At-fault and not-at-fault drivers using a mobile phone during the crash; relative risk and 95% confidence intervals. Driver samples from 1997 and 2007 separately, and combined (N = 9314)
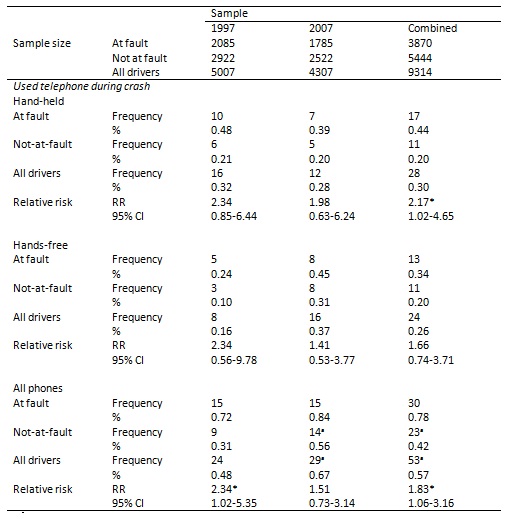
problem 5: Use the data in Table above to answer the following problems.
i) Refer to the combined data from the 1997 and 2007 surveys and describe in plain language the relative risk of having a car accident when driving while talking on a hand-held phone compared to not using a phone, including an explanation of the 95% confidence interval and statistical significance of the finding.
ii) Refer to the combined data from the 1997 and 2007 surveys and describe in plain language the relative risk of having a car accident when driving while talking on a hands-free phone compared to not using a phone, including an explanation of the 95% confidence interval and statistical significance of the finding.
iii) Refer to the 1997 survey data, the 2007 survey data and the combined data from the 1997 and 2007 surveys and describe in plain language the relative risk of having a car accident when driving while talking on any type of phone compared to not using a phone, including an explanation of the 95% confidence interval and statistical significance of each finding.
In order to control for potential confounding factors, the researchers performed a logistic regression on the combined data from 1997 and 2007.Gender, age, years with a driver’s licence, and driving exposure measured as annual kilometres were entered as independent variables. Logistic regression is a type of statistical analysis where the independent variables are dichotomous – this means participants fall into one category or another (e.g. Gender is either male or female; age is <25 years or ≥25 years; Years with a driver’s licence is <10 years or ≥10 years; and annual km driven is <15 000 km or ≥ 15,000 km). The likelihood of a particular outcome (odds ratio /OR) is then find outd based on each category.The results in Table below represent the likelihood (OR) that a mobile phone was used for talking when driving a car(ever) based on the independent variable. The referent category for each variable is shown in brackets in table below; an OR of 1.0 is assumed for each referent category. Independent variables that were found to have a statistically significant impact on the likelihood of ever driving while talking on a mobile phone are indicated by asterisks.
Table: Logistic regression with dependent variable “use of mobile phones while driving -ever” showing odds ratios associated with the independent variables controlled for.
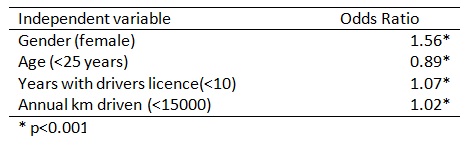
problem 6:
i) Using the data presented in Table above, describe in plain language the impact of each independent variable on the likelihood of ever having talked on a mobile phone when driving. Use both the odds ratio and the p values to describe the findings.
The researchers asked the 1997 and 2007 survey respondents (who were at fault of causing the accident) if they thought they could have avoided the crash if they had not been talking on the mobile phone while driving. The results from the available data are presented in Figure below.
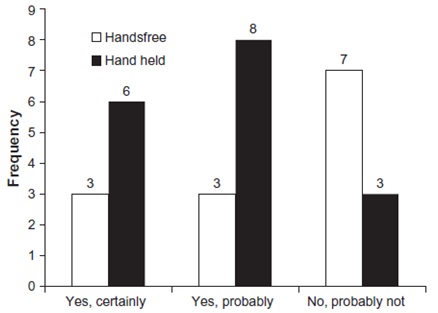
Figure: At-fault drivers’ responses to the problem” Do you believe the crash could have been avoided if you hadn’t used the telephone?” Data from 1997 and 2007 combined. N = 0.
problem 7: Using the information from Figure above, answer the following problems:
i) What percentage of respondents (who provided usable data) believed that they could have certainly avoided the crash if they had not being driving while talking on a hand-held mobile phone?
ii) What percentage of respondents (who provided usable data) believed that they could probably have avoided the crash if they had not being driving while talking on a hands-free mobile phone?
iii) What percentage of respondents (who provided usable data) believed that they probably could not have avoided the crash if they had not being driving while talking on any type of mobile phone?