Ask Statistics and Probability Expert

TASK A: Minitab analyses for Case Study

The data is listed in the table below and may be copied into Minitab (best to use the file task3.mtw). Use the menu item Stat_DOE_Factorial_Custom design to indicate that Minitab should use the information in the worksheet to set up a 2-level factorial design object. (The results will be seen in the Project Manager.)You should indicate that the worksheet data are coded but also enter the real “uncoded” values in the Low/High table.

131_Low-high table.jpg


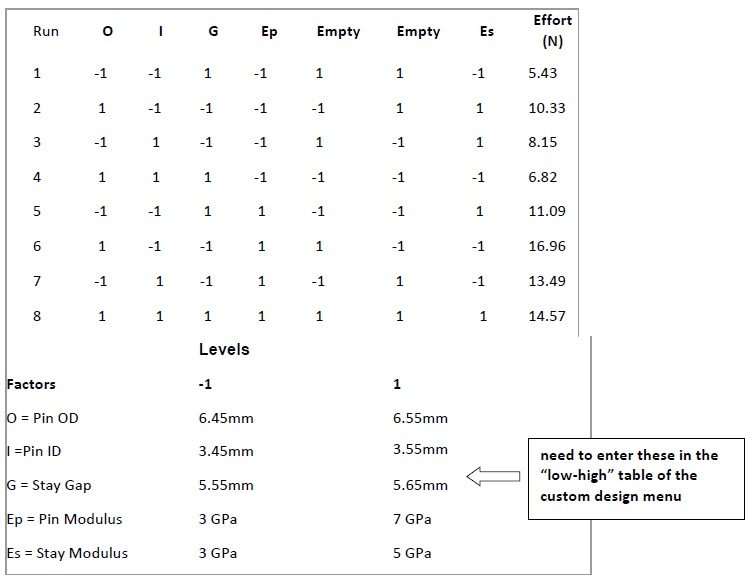
problem1) Use the Factorial/Factorial Plots option to display main effects plots for the response variable (Effort) using both coded and uncoded representations of the design variables (factors) including the “empty” columns. State what the plots suggest about important sources of variation in effort.

problem2) Now apply the Analyze Factorial Design item to the response variable effort choosing: (i) terms up to order 1 leaving out the empty columns, (ii) results with no alias table, (iii) graphs with normal plots of the main effects with alpha set at 0.1.

(a) Display the tabular form of the fitted equation with factors in coded form and use the 1 need to enter these in the equation to predict the mean effort for a flap having Pin OD = 6.45, Pin ID = 3.50, Stay Gap = 5.65, Ep = 5 and Es = 4. [Hint: factors which are exactly on target are coded as zero. You can just plug the values into the coded form of the fitted regression model, making sure to use coefficients not effects.]

(b) Display the normal plot and point out important similarities and differences between it and the main effects plots from problem 1. What conclusion does it suggest about important factors to consider?

(c) Add the empty columns back into the terms to be fitted, run the analysis menu again and display the resulting normal plots of the main effects. describe how this display further supports the conclusions you drew in part (b) about unimportant factors.

problem3)

(a) Try simply regressing the column Effort on the 5 design variables with the variables in coded form , leaving out “empty’ columns. (Use the Stat_Regression_Regression menu.) How do the results compare with part 2?

(b) Repeat the regression but now replace O and G by the interference (i.e. a column containing the difference O – G) and leave out I and Es and any empty columns. Interpret the result. You can still use the coded form of the design variables.

problem4) Now use Create Factorial Design to create an 8 run expt with 7 factors. (It should  open a new worksheet within your Minitab project) Use the default settings, but under Options do not randomize order, and choose summary and alias tables under Results. Display the design and compare it with that used in the lecture notes. Is it essentially the same design?
Optional: Use column multiplication to check the aliasing of C and DG. Referring back to the design used for the filler flap robustness investigation, could this aliasing create any doubt about the conclusions we have drawn about important design factors?

TASK B: Design optimisation

153_Design optimisation.jpg
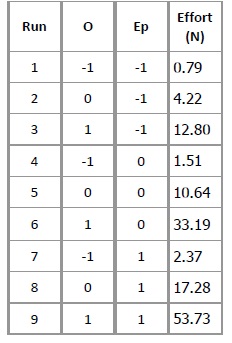
Enter the data from the above table in Minitab. Carry out the following tasks:

problem1) Fit and plot a quadratic response surface (with both surface plot and contour plot) relating the pin diameter and modulus to the effort. (Use DOE/Response Surface design.)

problem2) Find a target value for pin diameter that achieves the target effort (10.5N) established by the researchers (task 1 of the case study), when the pin modulus is at its mid-value used in this experiment.

problem3) Determine whether the expected variation in pin modulus can be accommodated within the acceptable range of efforts established in task 1 (of the case study). Assume that typical manufacturing variation in pin diameter is ±0.05mm and that variation in the pin modulus is the variation find outd as “ x¯ ± 3s ”  Comment on any assumptions you are making

problem4) In the light of your conclusions from part 3, how might you go about ensuring that the general flap design is comfortably able to achieve its objective regarding effort?

Statistics and Probability, Statistics

  • Category:- Statistics and Probability
  • Reference No.:- M9360

Have any Question?


Related Questions in Statistics and Probability

How does a histogram help us know the probability of

How does a histogram help us know the probability of getting a certain value for a variable? In other words how does the histogram relate to probability?

Amy wants to deposit money each year for the next five

Amy wants to deposit money each year for the next five years and each deposit to have $30,000 in real dollars currently and the inflation rate is 3% per year and the nominal interest rate is 9.18%. (Round off all answers ...

A customer service phone line claims that the wait times

A customer service phone line claims that the wait times before a call is answered by a service representative is less than 3.3 minutes. In a random sample of 62 calls, the average wait time before a representative answe ...

You have graduated from college but unfortunately have

You have graduated from college but unfortunately have $33,000 in outstanding loans. The loans require monthly payments of $3,700, which covers interest and principal repayment (that is, the loan has the same basic featu ...

Approximately once a month cars are shipped from rotterdam

Approximately once a month cars are shipped from Rotterdam, Holland to Lagos, Nigeria. The past data collection indicates that the weight of a car is normally distributed with the mean of 1,070 kg and the  standard devia ...

Mort is to pay off a loan of 75000 with equal payments at

Mort is to pay off a loan of $75,000 with equal payments at the end of every month over 10 years (i.e., 120 months). The ANNUAL effective rate is 5%. Mort decides that he can actually manage to pay double the monthly pay ...

Using excel a manufacturer of celsius thermometers claims

Using Excel, A manufacturer of Celsius thermometers claims the thermometers they produce have an average (mean) reading of 0 degrees Celsius and a standard deviation of 1 degree Celsius for freezing water . If one of the ...

Bar-eli azar ritov keidar-levin and schein 2007 analyzed

Bar-eli, Azar, Ritov, Keidar-Levin, and Schein (2007) analyzed 286 penalty kicks among professional soccer players. They recorded the direction that the ball was kicked (left, center, right) and the direction that the go ...

A nutritional scientist wishes to study the effect of

A nutritional scientist wishes to study the effect of storage time on the amount of vitamin C (milligrams) contained in 50 gram freeze dried fruit packs when stored for one, one and a half and 2 years. Five fruit packs w ...

A manufacture claims that the life span of its tires is

A manufacture claims that the life span of its tires is 52,000 miles. You work for a consumer protection agency and you are testing these tires. Assume the life spans of these tires are normally distributed. You select 1 ...

  • 4,153,160 Questions Asked
  • 13,132 Experts
  • 2,558,936 Questions Answered

Ask Experts for help!!

Looking for Assignment Help?

Start excelling in your Courses, Get help with Assignment

Write us your full requirement for evaluation and you will receive response within 20 minutes turnaround time.

Ask Now Help with Problems, Get a Best Answer

Why might a bank avoid the use of interest rate swaps even

Why might a bank avoid the use of interest rate swaps, even when the institution is exposed to significant interest rate

Describe the difference between zero coupon bonds and

Describe the difference between zero coupon bonds and coupon bonds. Under what conditions will a coupon bond sell at a p

Compute the present value of an annuity of 880 per year

Compute the present value of an annuity of $ 880 per year for 16 years, given a discount rate of 6 percent per annum. As

Compute the present value of an 1150 payment made in ten

Compute the present value of an $1,150 payment made in ten years when the discount rate is 12 percent. (Do not round int

Compute the present value of an annuity of 699 per year

Compute the present value of an annuity of $ 699 per year for 19 years, given a discount rate of 6 percent per annum. As