This assignment requires a considerable amount of computer work and written comment. You may need to seek guidance from your tutor along the way. Do not leave things until too late. Each question carefully describes what you are required to do, so please follow these carefully.
In this assignment, you will examine data from afruit and vegetable market that supplies fresh produce to supermarket outlets in NSW and Victoria. The market is conducting an evaluation in Sydney and Melbourne.The fruit and vegetable market wants toexamine the Price per kilogram (Price$/kg) at each of the outlets and is particularly interested in the relationship between Price$/kgand the type of produce; the season; and,quantity (sold per day).
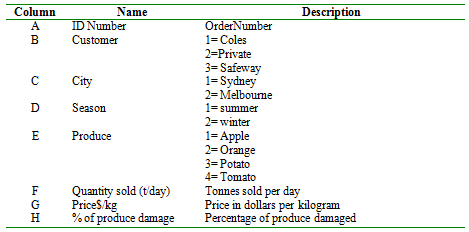
The data collected is contained in a file called 'Market.xls' and the columns of the file contain the following information:
You will need to generate a random sample of 200 customers. Your answers to the assignment tasks below are to be based on your sample of 200 customers. Make sure you keep a safe copy of your sample, since you cannot use Random Sample Generator to reproduce the first sample. (If necessary, talk to your tutor about generating a new sample.)
Assignment Tasks
For each task below, you must submit all of the required printouts, graphs, tables and summaries required.
NB:Each graph and table should have a heading and each axis should have a label!!
1. Introduction and Variable List:Give a brief introduction to your report, setting out the nature of the data.
2. Data: Provide a printout of the data in your sample, sorted in ascending order based onorder (ID)number.
3. Pivot Table: Prepare a contingency table (cross-classification) using the Pivot Table option in Excel that compares types ofproduceandseason. You may use counts or percentages as the basis of comparison. Compare any similarities or differences in the types ofproduce sold, betweensummer and winter.
4. Pivot Table:Prepare another contingency table that shows the average (mean) price$/kgand average (mean) Quantity sold (t/day), classified byseasonand the type ofproduce. Compare any similarities or differences between theseasons with regard to prices, and quantity ofapples and oranges sold:
a) Which seasonhas the highestaverage (mean) price$/kgfor oranges, and which for apples?
b) Which season has the highest mean Quantity sold (t/day)for oranges, and which for apples?
5. T-Test:The market wants to investigate if the price$/kgof oranges in winter is less thanthe mean summer price for oranges. The current data will be used as a typical representation of the price$/kg.
a) Determine the mean, standard deviation and standard error for the price$/kgin winter of oranges in your sample.
b) The market has found that, on average, the price of oranges in summer is $5.50/kg. Based on this information carry out a t-test to see if the average price$/kgin winter is less than the summer price of $5.50. Mention any assumptions, include relevant hypotheses and report the result and conclusion in the conventional manner.
6. Obtain a scatterplot of the Price$/kg and Quantity sold (t/day). Think carefully about which variable should go on the vertical axis. Remember, it is the independent variable that goes on the horizontal axis (i.e. the x-axis). Make sure you label your axes properly and that your graph has an appropriate title.
7. Briefly describe the nature of the relationship between these two variables:Price$/kg and Quantity sold (t/day).(Hint: mention strength and direction).
8. Use Excel to carry out a regression analysison two variables: Price$/kg(independent variable) and Quantity sold (t/day)(dependent variable).
a) Copy the output into your assignment and then use it to determine the answer to the following questions.
b) Write down the regression equation.
c) State the R-squared value and the standard error and explain what they mean with respect to the data.
d) Write down the value of the gradient of the regression line and explain what it means in the context of this question.
e) Are the values for the constant and intercept (slope coefficient) significant in this case? Justify your answer using values from the output.
f) Do you think this regression model is a good model? Justify your answer using the regression output.
9. Using the information obtained for your analyses write a short conclusion about what you found out about the relationship between the Quantity sold (t/day)and price$/kg, and how this relates to seasonand the type of produce.
Download:- Market.xls