Ask Question, Ask an Expert

+61-413 786 465

info@mywordsolution.com

Ask Statistics and Probability Expert

1) The t and F Distributions

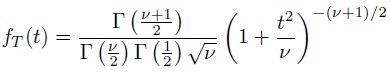
The T random variable with v degrees of freedom has the distribution

1886_T and F distribution.jpg

Show that the random variable F = T2 has the F distribution with 1 and v degrees of freedom.

2) An Unbiased Estimate of σ

The chi distribution models the square root of a chi-square random variable:

                        Y= √x      X~ x2 v

(a) Find the pdf of the chi distribution.

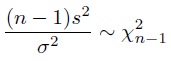
(b) We know that the sample variance from a normal distribution follows a chi-square distribution

265_chi square distribution.jpg

Find the expected value of the sample standard deviation, s, and suggest an adjustment that would make it unbiased. You may find the following formulas useful:

2057_Expected value.jpg

3) A Catch-and-Release Estimate

A park has N raccoons of which 10 were previously captured and tagged. Suppose that 20 raccoons are captured. Find the probability that n = 5 of these are found to be tagged. Denote this probability by p(N).

(a) Find the value of N that maximizes p(N); this is called a maximum likelihood estimate. Hint: compare the ratio p(N)/p(N -1) to unity.

(b) Plot the maximum likelihood estimate of N against varying values of n, from 1 to 10.

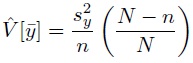
4) Finite Population Correction Factor

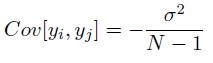
For a finite population of size N with mean µ and variance σ2, it can be shown that the covariance of any two observations in a sample is

398_covariance.jpg

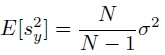
and that the sample variance is slightly biased

1226_biased sample variance.jpg

This means that the variance of the sample mean, when drawn from a finite population, includes a covariance term. This gives rise to the finite population correction factor. Use these relationships to show that the variance of the sample mean is

2482_mean variance.jpg

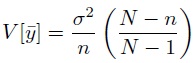
and that this is estimated by

813_Estimation of variance.jpg

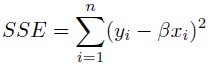
5) Zero-Intercept Regression

Some phenomena follow a linear model which has an inherent zero response for a zero predictor, so the candidate regression model is

y=βx+ε

(a) Find the ordinary least squares estimator for β  by minimizing the sum of squared errors

535_least square estimator.jpg

(b) It seems reasonable that the variance around the regression line would increase as the predictor increases (think of the line swinging around the fixed "pivot" at the origin). If the error was normally distributed, this could give rise to the conditional distribution

1940_conditional distribution.jpg

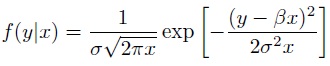
Assuming this distribution, find the maximum likelihood estimator for β .

describe why this is called a ratio estimator.

(c) for the following data, estimate β using both your OLS and MLE estimators.

x  0.5 1.5 3.2 4.2 5.1 6.5

y  1.3 3.4 6.7 8.0 10.0 13.2

6) A Truncated Distribution

Students in several statistics classes were asked to complete a problemnaire. One of the quantities asked was the number of siblings a student had. This is a summary of the responses:

siblings    frequency

0                  4

1                 22

2                 22

3                 11

4                  8

5                  3

6                  3

12               1

20               1

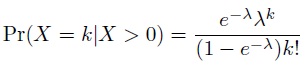
6.1) Problem. Use the sibling data to estimate a distribution for the number of children in a family. Obviously, the number of children is one more than the number of siblings. However, there is a selection bias in this measurement; families with no children cannot be reported this way! Therefore the data follows a zero-truncated Poisson distribution (ZTPD)

1160_zero-truncated poisson distribution.jpg

(a) Find the MLE for the parameter λ of the ZTPD.

(b) What are the mean and variance of the ZTPD? Rather than directly calculating the moments, you might find it simpler to use the probability generating function

                                                  Gk(z) = E[zk]

and then take advantage of the properties of the pgf:

E[K] = G'k(z = 1)   V ar[K] = G"k(z = 1) + G'k(z = 1)- [G'k(z=1)]2

(c) Estimate the mean for the number of children and determine whether the data fits a ZTPD with that mean.

7) Estimating with Confidence The times to failure (in hours) for a sample of n = 30 backup generators are

7494.7       8801.7     9990.7      11277.7     10173.3      7746.8

9003.6       8242.9     4532.2      12541.8      6766.9       9898.9

8922.0       13429.8   17623.5    9135.6        6029.8       9038.7

20972.0     7605.1     5396.6      7528.2        10330.6     6475.4

12390.9     9857.0     7067.6      9704.2         5055.8      9942.4

(a) Find the mean time to failure and a 95% confidence interval (use a t distribution).

(b) Find a 95% confidence interval for the standard deviation (start with a chi-square interval for the variance).

Statistics and Probability, Statistics

  • Category:- Statistics and Probability
  • Reference No.:- M9290

Have any Question?


Related Questions in Statistics and Probability

A major car manufacturer wants to test a new engine to

A major car manufacturer wants to test a new engine to determine if it meets new air pollution standards. The mean emission μ of all engines of this type must be approximately 18 parts per million of carbon. If it is hig ...

Lets pretend that in a hospital 7 of patients are high-risk

Let's pretend that in a hospital, 7% of patients are "high-risk" while the others are "lower-risk". For patients that are high-risk, 75% will be re-admitted within 30 days. For "lower-risk" patients, the 30day re-admitta ...

Cardinal industries had the following operating results for

Cardinal Industries had the following operating results for 2018: Sales = $33,813; Cost of goods sold = $23,967; Depreciation expense = $5,947; Interest expense = $2,685; Dividends paid = $1,951. At the beginning of the ...

An electronics store receives a shipment of 37 graphing

An electronics store receives a shipment of 37 graphing calculators, including 5 that are defective. Eight calculators are chosen at random to be sent to a local high school. How many selections contain 3 defective?

Consider the probability distribution shown belowx 0 1 2 px

Consider the probability distribution shown below. x 0 1 2 P(x) 0.65 0.30 0.05 Compute the expected value of the distribution. Compute the standard deviation of the distribution. (Round your answer to four decimal places ...

A recent study found that 64 of workers between the ages of

A recent study found that 64?% of workers between the ages of? 20-29 cash out their retirement accounts when they lose their jobs or move to a new employer. Complete parts a through e below based on a random sample of 14 ...

Five percent of the eyeglasses sold at an optical retailer

Five percent of the eyeglasses sold at an optical retailer have tinted lenses. Forty pairs of glasses are sold on a particular day and six have tinted lenses. Identify n, p, and x.

Q1 what would the best approach to evaluating whether the

Q1. What would the best approach to evaluating whether the extension to the new line be? would an IRR / NPV approach be adequate? Q2. My understanding is that we would take the sales of the extension of the modern line ( ...

Consider the following random sample ofnbspdata8 6 -6 0 -9

Consider the following random sample of data: 8, 6, -6, 0, -9, 4, -1, 7, 6, 84 a) What is the standard deviation of the sample data? Round your response to at least 3 decimal places. b) If the outlier is removed, what is ...

A in how many ways can 5 men and women stand in a queue in

(a) In how many ways can 5 men and women stand in a queue in such a way that no two women stand together and no two men stand together? (b) A librarian wants to put 30 different books on 3 shelves, 10 books on each shelf ...

  • 4,153,160 Questions Asked
  • 13,132 Experts
  • 2,558,936 Questions Answered

Ask Experts for help!!

Looking for Assignment Help?

Start excelling in your Courses, Get help with Assignment

Write us your full requirement for evaluation and you will receive response within 20 minutes turnaround time.

Ask Now Help with Problems, Get a Best Answer

Why might a bank avoid the use of interest rate swaps even

Why might a bank avoid the use of interest rate swaps, even when the institution is exposed to significant interest rate

Describe the difference between zero coupon bonds and

Describe the difference between zero coupon bonds and coupon bonds. Under what conditions will a coupon bond sell at a p

Compute the present value of an annuity of 880 per year

Compute the present value of an annuity of $ 880 per year for 16 years, given a discount rate of 6 percent per annum. As

Compute the present value of an 1150 payment made in ten

Compute the present value of an $1,150 payment made in ten years when the discount rate is 12 percent. (Do not round int

Compute the present value of an annuity of 699 per year

Compute the present value of an annuity of $ 699 per year for 19 years, given a discount rate of 6 percent per annum. As