The time plot below is for motor vehicle deaths in the United States. The rate is the number of deaths per million miles driven and is plotted for the 18 years 1960, 1962, 1964, ..., 1992, 1994 ( a data point every second year).
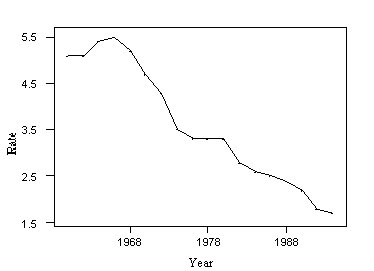
Suppose we drew a histogram of these 18 death rates using class intervals 1 — 1.9, 2 — 2.9, 3 — 3.9, 4 — 4.9 and 5 — 5.9. Using the histogram, we would
A. lose all information about trends over time.
B. be able to compute the number of years in this period for which the death rate was 5 or higher.
C. Both answers are correct.