Ask Question, Ask an Expert

+61-413 786 465

info@mywordsolution.com

Ask Applied Statistics Expert

Statistics Homework -

Q1. Exploratory Factor Analysis

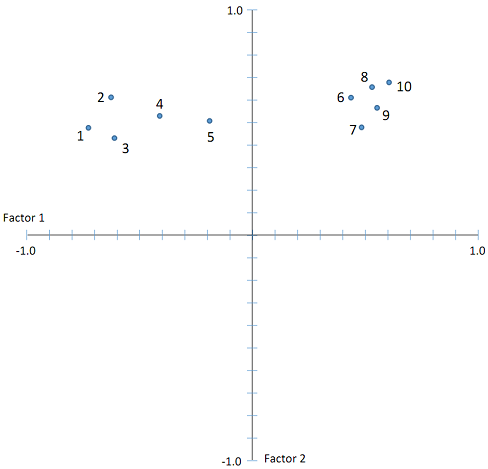
1. Below is a loading plot for two factors of a 10-item test. The two axes describe the unrotated factor solution for the two factors, with each axis reflecting the item loadings on the two factors. From this plot, (a) recreate the matrix of factor loadings, in tabular form (hint: a ruler should make this easy). (b) Explain whether a rotation is needed and if so, what kind? (hint: you may need to draw on a printout to figure this out) (c) Do you see any problems with any of the items (i.e., either with or without rotation)? (d) If all of the factors (i.e., not just the two extracted here) accounted for 100% of the variance in the set of 10 items, what kind of analysis was run? (e) For this kind of analysis (the one you identified in part d), if the first factor had an eigenvalue of 5 and the second factor had a value of 2, then what was the average percentage of variance accounted for by the remaining factors?

1256_figure.png

Q2. Confirmatory Factor Analysis

You have a 10-item test of leadership potential. Four items assess agency (i.e., being a good task-master), four items assess communion (i.e., being a good listener), and two items assess conscientiousness (i.e., being responsible). In the space below, (a) draw the overall confirmatory factor model as completely as possible. (b) Is this model likely to be identified? How do you know this? (And I mean specifically, with numbers to back up your knowledge) (c) Based on what you know from parts a and b, what problems might you anticipate with the measure? (d) After examining some initial data, the modification indices suggest that the residual of the fourth item of the agency factor is correlated with the residual of the second item of the conscientiousness factor. Draw this parameter in the model and explain whether it would be a good idea or not to include it in future models of the measure.

Q3. Measurement Equivalence

You are also interested in whether your test of leadership potential functions equivalently for males and females. (a) Recreate 2 drawings of the overall model from problem 5, though leave out the correlated measurement error (one for males and one for females, ideally side-by-side or top and bottom on the same sheet if you can fit it legibly). Using lowercase letters, indicate the constraints that are needed to examine metric equivalence. (b) Using numbers, indicate in the figure the constraints that are needed to examine measurement error equivalence. There is no need to include constraints for scalar equivalence. (c) If you find that a model estimating all parameters separately for males and females fits significantly better (i.e., according to the χ2) than the model in part a, what would you conclude? (d) What would you conclude if the model estimating all parameters separately for males and females fit worse than the model in part a?

Applied Statistics, Statistics

  • Category:- Applied Statistics
  • Reference No.:- M92802637

Have any Question?


Related Questions in Applied Statistics

Assignment - statistics in educational researchpart a -

Assignment - Statistics in Educational Research Part A - Show all your work Q1) A teacher asked each of her students how many novels they had read in the previous six months. The results are shown below. 0 1 5 4 2 1 3 2 ...

Question - go to the website national quality forum nqf

Question - Go to the website, National Quality Forum (NQF), located in the Webliography, and download the article by WIRED FOR QUALITY: The Intersection of Health IT and Healthcare Quality, Number 8, MARCH 2008. You are ...

Assignment -for each of the prompts below report the

Assignment - For each of the prompts below, report the appropriate degrees of freedom, t statistic, p-value and plot using the statistical software platform of your choice (R/STATA) 1) A sample of 12 men and 14 women hav ...

Linear project instructions -curve-fitting project - linear

Linear Project instructions - Curve-fitting Project - Linear Model For this assignment, collect data exhibiting a relatively linear trend, find the line of best fit plot the data and the line, interpret the slope, and us ...

Question onea a factory manager claims that workers at

QUESTION ONE (a) A factory manager claims that workers at plant A are faster than those at plant B. To test the claim, a random sample of times (in minutes) taken to complete a given task was taken from each of the plant ...

Go to the webliography source for the national cancer

Go to the Webliography source for the National Cancer Institute's Surveillance, Epidemiology, and End Results (SEER) Program. In the Fast Stats, create your own cancer statistical report, "Stratified by Data Type," and u ...

Construct a regression model for predicting total charges

Construct a regression model for predicting total charges from length of stay for DRG 105. a. State the null and alternative hypotheses and alpha level. b. Prepare a scatter diagram with the regression line for the two v ...

Business analytics and statistics research report -this

Business Analytics and Statistics Research Report - This assignment is based on fictional data. You are creating a business report for the CEO of a retail company called, Athlete Panda. It must be professional in present ...

Business statistics project -problem description the

BUSINESS STATISTICS PROJECT - Problem Description: The blockchain is a decentralized ledger of all transactions across a peer-to-peer network. Using this technology, participants can confirm transactions without a need f ...

Quantitative methods in health statistical analysis report

Quantitative Methods in Health Statistical Analysis Report - Question 1 - Are you a Lark or an Owl? Studies indicate that about 10% of us are morning people (Larks) while 20% are evening people (Owls) and the rest are no ...

  • 4,153,160 Questions Asked
  • 13,132 Experts
  • 2,558,936 Questions Answered

Ask Experts for help!!

Looking for Assignment Help?

Start excelling in your Courses, Get help with Assignment

Write us your full requirement for evaluation and you will receive response within 20 minutes turnaround time.

Ask Now Help with Problems, Get a Best Answer

Why might a bank avoid the use of interest rate swaps even

Why might a bank avoid the use of interest rate swaps, even when the institution is exposed to significant interest rate

Describe the difference between zero coupon bonds and

Describe the difference between zero coupon bonds and coupon bonds. Under what conditions will a coupon bond sell at a p

Compute the present value of an annuity of 880 per year

Compute the present value of an annuity of $ 880 per year for 16 years, given a discount rate of 6 percent per annum. As

Compute the present value of an 1150 payment made in ten

Compute the present value of an $1,150 payment made in ten years when the discount rate is 12 percent. (Do not round int

Compute the present value of an annuity of 699 per year

Compute the present value of an annuity of $ 699 per year for 19 years, given a discount rate of 6 percent per annum. As