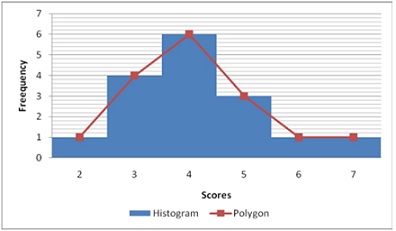
1) Draw a histogram and frequency polygon illustrating distribution of scores presented in the following table:
X f
7 1
6 1
5 3
4 6
3 4
2 1
2) Schmidt (1994) carried out a series of experiments investigate effects of humour on memory. In 1 study, participants were given a list of sentences, of which half were humorous and half were non-humorous. Schmidt then measured number of each kind of sentence recalled by each participant. Following are hypothetical results comparable to those got by Schmidt:
Number of Sentences recalled
Humorous Sentences Non-humorous Sentences
4 5 2 4 5 2 4 2
6 7 6 6 2 3 1 6
2 5 4 3 3 2 3 3
1 3 5 5 4 2 5 3
a) Recognize independent variable and dependent variable for this experiment. Think in your head what influences what? Or, what causes what? Cause is independent variable. Variable being caused is dependent. If X then Y.
b) Draw a polygon illustrating the frequency distribution for humorous sentences. In same graph, draw a polygon for non-humorous sentences. (Use 2 various colours, or use solid line for one polygon and dashed line for the other.) Does it appear that humour has the influence on memory?