Ask Question, Ask an Expert

+61-413 786 465

info@mywordsolution.com

Ask Statistics and Probability Expert

Question: Refer to the data on weights of 44 college students given in Exercise. Create a dotplot of all 44 weights. Then create stacked dotplots for the weights of male and female students. Describe the similarities and differences in the distributions of weights of male and female students. Using all three dotplots, explain why you cannot distinguish the lightest males from the heaviest females when you consider only the dotplot of all 44 weights.

Exercise: Statisticians often need to know the shape of a population to make inferences. Suppose that you are asked to specify the shape of the population of weights of all college students.

a. Sketch a graph of what you think the weights of all college students would look like.

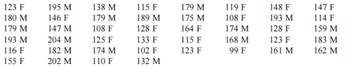
b. The following data give the weights (in pounds) of a random sample of 44 college students (F and M indicate female and male, respectively)

881_21.png

i. Construct a stem-and-leaf display for these data.

ii. Can you explain why these data appear the way they do?

c. Now sketch a new graph of what you think the weights of all college students look like. Is this similar to your sketch in part a?

Statistics and Probability, Statistics

  • Category:- Statistics and Probability
  • Reference No.:- M92487948
  • Price:- $15

Priced at Now at $15, Verified Solution

Have any Question?


Related Questions in Statistics and Probability

The risk rate of return is currently 005 whereas the market

The risk rate of return is currently 0.05, whereas the market risk premium is 0.05. if the beta of RKP, inc ,stock is 1.9 , then what is the expected return on RKP?

The distribution of heights of adult american women is

The distribution of heights of adult American women is approximately normal with a mean of 64 inches and standard deviation of 2 inches. What percent of women is taller than 68 inches?

Based on the 1990 census the number of hours per day adults

Based on the 1990 census, the number of hours per day adults spend watching television is approximately normally distributed with a mean of 5 hours and a standard deviation of 1.3 hours. What proportion of the population ...

The table to the right shows the results of a survey in

The table to the right shows the results of a survey in which 2575 adults from Country? A, 1126 adults from Country? B, and 1072 adults from Country C were asked if human activity contributes to global warming. Complete ...

The dow jones industrial average has had a mean gain of 432

The Dow Jones Industrial Average has had a mean gain of 432 pear year with a standard deviation of 722. A random sample of 40 years is selected. What is the probability that the mean gain for the sample was between 200 a ...

If net income in 2012 956 and if the following changes

If net income in 2012 = $956, and if the following changes occur between 2011 and 2012, compute Net Cash Flow from Operating Activities for 2012: Accounts receivable change from $157 to $237 Gross fixed assets change fro ...

Jen and barry perform a survey of consumers about home meal

Jen and Barry perform a survey of consumers about home meal salad preferences ("fresh" or "fast"). 395 consumers said they prefer to make fresh salad. 426 said they prefer to make salad fast (out of a bag). 331 said they ...

On a correlation matrix you will usually see two values per

On a correlation matrix, you will usually see two values per comparison. The top value for a correlation measurement will be the Pearson correlation, right under that you will see a p-value. I understand when you have a ...

A researcher records the following body mass index bmi

A researcher records the following body mass index (BMI) scores for a group of participants: 29.1 1.3 (M SD). Participants who score between 26 and 30 on this scale are categorized as overweight. What proportion of parti ...

Table 1 fasting bloodfbs of group afbs of group

Table 1. Fasting Blood FBS of Group A FBS of Group B 95  90 100 100 125 125 175 200 250  550 1. What is the mean fasting blood sugar value for each group? What is the median? Mode? Group A: mean:145, median: 125, mode: n ...

  • 4,153,160 Questions Asked
  • 13,132 Experts
  • 2,558,936 Questions Answered

Ask Experts for help!!

Looking for Assignment Help?

Start excelling in your Courses, Get help with Assignment

Write us your full requirement for evaluation and you will receive response within 20 minutes turnaround time.

Ask Now Help with Problems, Get a Best Answer

Why might a bank avoid the use of interest rate swaps even

Why might a bank avoid the use of interest rate swaps, even when the institution is exposed to significant interest rate

Describe the difference between zero coupon bonds and

Describe the difference between zero coupon bonds and coupon bonds. Under what conditions will a coupon bond sell at a p

Compute the present value of an annuity of 880 per year

Compute the present value of an annuity of $ 880 per year for 16 years, given a discount rate of 6 percent per annum. As

Compute the present value of an 1150 payment made in ten

Compute the present value of an $1,150 payment made in ten years when the discount rate is 12 percent. (Do not round int

Compute the present value of an annuity of 699 per year

Compute the present value of an annuity of $ 699 per year for 19 years, given a discount rate of 6 percent per annum. As