Ask Statistics and Probability Expert

Question: Plot the scatter diagram using the crude birth rate as the Y variable and GDP per capita as the X variable from the data given in Problem.

(a) Fit a least-squares regression line and compute T.

(b) Try a transformation on X and recompute r. Did it increase, and if so, why?

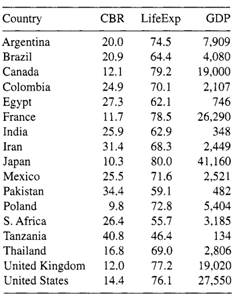
Problem: The following table contains data from 17 countries. These countries are a systematic sample from twice this number of countries that had a population > 30 million people in 1998 and had complete data. The data were taken from the US. Bureau of the Census, Statistical Abstracts of the United States; 1998, 118th ed., Washington, DC. It consists of the crude birth rate (CBR) or the total number of births divided by the total population in 1998, life expectancy (LifeExp) from birth in years for the overall population, and gross domestic product (GDP) per capita for 1995. The GDP has been adjusted and then converted to U.S. dollars.

781_CBR.png

(a) State which model the data in the table follows.

(b) Plot the scatter diagram when X = life expectancy and Y = crude birth rate and fit a regression line.

(c) Does the data appear to follow a straight line?

(d) If life expectancy increased by 10 years, what do you expect to happen to the crude birth rate?

(e) Test that Ho : β = 0. If you test that p = 0, will you get the same P value?

Statistics and Probability, Statistics

  • Category:- Statistics and Probability
  • Reference No.:- M92524852
  • Price:- $15

Priced at Now at $15, Verified Solution

Have any Question?


Related Questions in Statistics and Probability

Introduction to epidemiology assignment -assignment should

Introduction to Epidemiology Assignment - Assignment should be typed, with adequate space left between questions. Read the following paper, and answer the questions below: Sundquist K., Qvist J. Johansson SE., Sundquist ...

Question 1 many high school students take the ap tests in

Question 1. Many high school students take the AP tests in different subject areas. In 2007, of the 144,796 students who took the biology exam 84,199 of them were female. In that same year,of the 211,693 students who too ...

Basic statisticsactivity 1define the following terms1

BASIC STATISTICS Activity 1 Define the following terms: 1. Statistics 2. Descriptive Statistics 3. Inferential Statistics 4. Population 5. Sample 6. Quantitative Data 7. Discrete Variable 8. Continuous Variable 9. Qualit ...

Question 1below you are given the examination scores of 20

Question 1 Below you are given the examination scores of 20 students (data set also provided in accompanying MS Excel file). 52 99 92 86 84 63 72 76 95 88 92 58 65 79 80 90 75 74 56 99 a. Construct a frequency distributi ...

Question 1 assume you have noted the following prices for

Question: 1. Assume you have noted the following prices for paperback books and the number of pages that each book contains. Develop a least-squares estimated regression line. i. Compute the coefficient of determination ...

Question 1 a sample of 81 account balances of a credit

Question 1: A sample of 81 account balances of a credit company showed an average balance of $1,200 with a standard deviation of $126. 1. Formulate the hypotheses that can be used to determine whether the mean of all acc ...

5 of females smoke cigarettes what is the probability that

5% of females smoke cigarettes. What is the probability that the proportion of smokers in a sample of 865 females would be greater than 3%

Armstrong faber produces a standard number-two pencil

Armstrong Faber produces a standard number-two pencil called Ultra-Lite. The demand for Ultra-Lite has been fairly stable over the past ten years. On average, Armstrong Faber has sold 457,000 pencils each year. Furthermo ...

Sppose a and b are collectively exhaustive in addition pa

Suppose A and B are collectively exhaustive. In addition, P(A) = 0.2 and P(B) = 0.8. Suppose C and D are both mutually exclusive and collectively exhaustive. Further, P(C|A) = 0.7 and P(D|B) = 0.5. What are P(C) and P(D) ...

The time to complete 1 construction project for company a

The time to complete 1 construction project for company A is exponentially distributed with a mean of 1 year. Therefore: (a) What is the probability that a project will be finished in one and half years? (b) What is the ...

  • 4,153,160 Questions Asked
  • 13,132 Experts
  • 2,558,936 Questions Answered

Ask Experts for help!!

Looking for Assignment Help?

Start excelling in your Courses, Get help with Assignment

Write us your full requirement for evaluation and you will receive response within 20 minutes turnaround time.

Ask Now Help with Problems, Get a Best Answer

Why might a bank avoid the use of interest rate swaps even

Why might a bank avoid the use of interest rate swaps, even when the institution is exposed to significant interest rate

Describe the difference between zero coupon bonds and

Describe the difference between zero coupon bonds and coupon bonds. Under what conditions will a coupon bond sell at a p

Compute the present value of an annuity of 880 per year

Compute the present value of an annuity of $ 880 per year for 16 years, given a discount rate of 6 percent per annum. As

Compute the present value of an 1150 payment made in ten

Compute the present value of an $1,150 payment made in ten years when the discount rate is 12 percent. (Do not round int

Compute the present value of an annuity of 699 per year

Compute the present value of an annuity of $ 699 per year for 19 years, given a discount rate of 6 percent per annum. As