Ask Question, Ask an Expert

+61-413 786 465

info@mywordsolution.com

Ask Statistics and Probability Expert

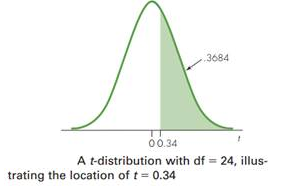
Question: Draw a picture of each of the following distributions. Shade the area above the value given, and label the proportion of the distribution that falls in that region, as in Figure. You do not have to label the vertical axis. Note: For parts (b) and (c), the use of either statistical software or Excel is necessary.

a. Standard normal distribution; z = 0.70.

b. t-distribution with df = 10, t = 0.70.

c. t-distribution with df = 10, t = -0.70.
124_Location.png

Statistics and Probability, Statistics

  • Category:- Statistics and Probability
  • Reference No.:- M92537157
  • Price:- $15

Priced at Now at $15, Verified Solution

Have any Question?


Related Questions in Statistics and Probability

Suppose that the height x in inches of a 20 year old man is

Suppose that the height (x), in inches of a 20 year old man is a normal random variable with a mean of 70 inches and standard deviation of 5.102 inches. What is the 97.5th percentile of all 20 year old men's heights?

According to national data about 14 of american college

According to national data, about 14% of American college students earn a graduate degree. Using this estimate, what is the probability that exactly 24 undergraduates in a random sample of 200 students will earn a colleg ...

Find a 95confidence interval for the population mean using

Find a 95%confidence interval for the population mean, using the formula or technology. Assuming that the population is normally distributed, construct a 95% confidence interval for the population mean, based on the foll ...

Your supervisor comes to you and says she would like a

Your supervisor comes to you and says she would like a marketing research study. She says there is a budget of $30,000. She would like to conduct a simple random sample of consumers interested in using the services of th ...

Introduction to statistics assignment - inferential

Introduction to Statistics Assignment - Inferential Statistics Analysis and Writeup Purpose: The purpose of this assignment is to develop and carry out an inferential statistics analysis plan and write up the findings. T ...

List the three assumptions of the independent groups t-test

List the three assumptions of the independent groups t-test. The consequences of violating which assumption are exacerbated if you have unequal N

What is the algebraic equation for the coefficient fo

What is the algebraic equation for the coefficient fo variations?

The diameter of ping pong balls manufactured at a large

The diameter of Ping Pong balls manufactured at a large factory are approximately normally distributed with a mean diameter of 1.30 inches and a standard deviation of .04 inches. Use Excel to calculate the probability of ...

1 you roll a fair four-sided die twice with sides numbered

1. You roll a fair four-sided die twice, with sides numbered 1,2,3 & 4, shaking it well each time before rolling. Let A be the event that your rst role is strictly less than 3 and B be the event that your second role is ...

A shipment contains 11 tvs of which two are defective a

A shipment contains 11 TV's, of which two are defective. A sample of three TV's is selected at random. In how many ways can no defective TV's be chosen?

  • 4,153,160 Questions Asked
  • 13,132 Experts
  • 2,558,936 Questions Answered

Ask Experts for help!!

Looking for Assignment Help?

Start excelling in your Courses, Get help with Assignment

Write us your full requirement for evaluation and you will receive response within 20 minutes turnaround time.

Ask Now Help with Problems, Get a Best Answer

Why might a bank avoid the use of interest rate swaps even

Why might a bank avoid the use of interest rate swaps, even when the institution is exposed to significant interest rate

Describe the difference between zero coupon bonds and

Describe the difference between zero coupon bonds and coupon bonds. Under what conditions will a coupon bond sell at a p

Compute the present value of an annuity of 880 per year

Compute the present value of an annuity of $ 880 per year for 16 years, given a discount rate of 6 percent per annum. As

Compute the present value of an 1150 payment made in ten

Compute the present value of an $1,150 payment made in ten years when the discount rate is 12 percent. (Do not round int

Compute the present value of an annuity of 699 per year

Compute the present value of an annuity of $ 699 per year for 19 years, given a discount rate of 6 percent per annum. As