Question 1:
The eruption height and the time interval after eruption of a geyser were measured and are shown below. Answer parts a-c.
| Height (x) |
Interval after (y) |
| 130 |
82 |
| 150 |
77 |
| 115 |
40 |
| 110 |
84 |
| 100 |
55 |
| 110 |
84 |
| 115 |
91 |
| 140 |
73 |
view a table of critical values for the correlation coefficient.
a. Find the value of the linear correlation coefficient r.
b. Find the critical values of r from the table showing the critical values for the Pearson correlation coefficient using α = 0.05.
c. Is there sufficient evidence to conclude that there is a linear correlation between the two variables?
A. Yes, because the absolute value of the correlation coefficient is less than the critical value.
B. Yes, because the absolute value of the correlation coefficient is greater than the critical value.
C. No, because the absolute value of the correlation coefficient is less than the critical value.
D. No, because the absolute value of the correlation coefficient is greater than the critical value.
Question 2:
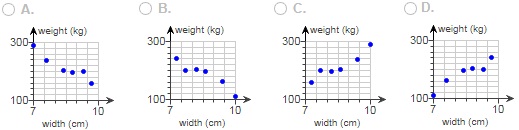
Listed below are the overhead widths (in cm) of seals measured from photographs and the weights (in kg) of the seals. Construct a scatterplot, find the value of the linear correlation coefficient r, and find the critical values of r using α = 0.01. Is there sufficient evidence to conclude that there is a linear correlation between overhead widths of seals from photographs and the weights of the seals?
| Overhead Width |
Weight |
| 7 |
111 |
| 7.6 |
163 |
| 9.7 |
243 |
| 9.3 |
200 |
| 8.8 |
204 |
| 8.4 |
195 |
view a table of critical values for the correlation coefficient.
Construct a scatterplot. Choose the correct graph below.
Question 3:
The data below shows height (in inches) and pulse rates (in beats per minute) of a random sample of women. Answer parts a-c.
| height (x) |
pulse rate (y) |
| 64.2 |
76 |
| 67.4 |
73 |
| 61.1 |
88 |
| 60.7 |
62 |
| 60.4 |
74 |
| 62.6 |
67 |
| 60.5 |
84 |
| 61.4 |
60 |
| 67.9 |
69 |
| 60.5 |
65 |
| 67.9 |
81 |
| 64.5 |
80 |
a. Find the value of the linear correlation coefficient r.
b. Find the critical values of r from the table showing the critical values for the Pearson correlation coefficient using α = 0.05.
c. Is there sufficient evidence to conclude that there is a linear correlation between the two variables?
A. Yes, because the absolute value of the correlation coefficient is greater than the critical value.
B. Yes, because the absolute value of the correlation coefficient is less than the critical value.
C. No, because the absolute value of the correlation coefficient is greater than the critical value.
D. No, because the absolute value of the correlation coefficient is less than the critical value.
Question 4:
A sample of 60 women is obtained, and their heights (in inches) and pulse rates (in beats per minute) are measured. The linear correlation coefficient is 0.263 and the equation of the regression line is y^ = 17.7 + 0.940x, where x represents height. The mean of the 60 heights is 63.2 in and the mean of the 60 pulse rates is 77.5 beats per minute. Find the best predicted pulse rate of a woman who is 68 in tall. Use a significance level of α = 0.01.
Question 5:
Listed below are systolic blood pressure measurements (in mm Hg) obtained from the same woman. Find the regression equation, letting the right arm blood pressure be the predictor (x) variable. Find the best predicted systolic blood pressure in the left arm given that the systolic blood pressure in the right arm is 80 mm Hg. Use a significance level of 0.05.
| Right Arm |
Left Arm |
| 100 |
175 |
| 99 |
168 |
| 91 |
182 |
| 79 |
142 |
| 78 |
143 |
The regression equation is y^ = __ + __x.
Question 6:
Use the value of the linear correlation coefficient r to find the coefficient of determination and the percentage of the total variation that can be explained by the linear relationship between the two variables.
r= 0.2
What is the value of the coefficient of determination?
What is the percentage of the total variation that can be explained by the linear relationship between the two variables?
Question 7:
Eight different medical students took blood pressure measurements of the same patient and the results are listed below.
The regression equation is y^ = -16.883311 + 0.783796x and the standard error of the estimate is 2.6958. Assume that the necessary conditions of normality and variance are met, and answer parts a and b.
| systolic (x) |
diastolic (y) |
| 135 |
87 |
| 130 |
85 |
| 140 |
97 |
| 136 |
88 |
| 120 |
78 |
| 129 |
83 |
| 125 |
84 |
| 130 |
82 |
a. Find the predicted diastolic reading given that the systolic reading is 134.
b. Find a 95% prediction interval estimate of the diastolic reading given that the systolic reading is 134.
Question 8:
When generating random digits, we can test the generated digits for goodness-of-fit with the distribution in which all of the digits are equally likely. What does an exceptionally large value of the χ2 test statistic suggest about the goodness-of-fit? What does an exceptionally small value of the χ2 test statistic (such as 0.002) suggest about the goodness-of-fit?
Choose the correct answer below.
A. Large test statistic - fit is not good. Small test statistic - fit is not good.
B. Large test statistic - fit is not good. Small test statistic - fit is extremely good.
C. Large test statistic - fit is extremely good. Small test statistic - fit is not good.
D. Large test statistic - fit is extremely good. Small test statistic - fit is extremely good.
Question 9:
Conduct the hypothesis test and provide the test statistic, critical value and P-value, and state the conclusion.
A person purchased a slot machine and tested it by playing it 1,270 times. There are 10 different categories of outcomes, including no win, win jackpot, win with three bells, and so on. When testing the claim that the observed outcomes agree with the expected?
frequencies, the author obtained a test statistic of χ2 = 19.143. Use a 0.05 significance level to test the claim that the actual outcomes agree with the expected frequencies. Does the slot machine appear to be functioning as expected?
The test statistic is __.
Question 10:
Conduct the hypothesis test and provide the test statistic, critical value and P-value, and state the conclusion.
A person randomly selected 100 credit card purchases and recorded the cents portions of those amounts. The table below lists those cents portions categorized according to the indicated values. Use a 0.025 significance level to test the claim that the four categories are equally likely. The person expected that many checks for whole dollar amounts would result in a disproportionately high frequency for the first category, but do the results support that expectation?
| Cents portion |
Number |
| 0-24 |
32 |
| 25-49 |
22 |
| 50-74 |
20 |
| 75-99 |
26 |
The test statistic is___.
Question 11:
Hypothesis tests based on this section, "Contingency Tables", are always what type of hypothesis test?
Choose the correct answer below.
A. Right-tailed
B. Two-tailed
C. Left-tailed
Question 12:
Winning team data were collected for teams in different sports, with the results given in the table below. Use the TI-83/84 Plus results at a 0.05 level of significance to test the claim that home/visitor wins are independent of the sport.
TI-83/84 PLUS
χ2- test
χ2 =7.092988473
P = 0.0689922371
df = 3
|
|
Basketball
|
Baseball
|
Hockey
|
Football
|
|
Home team wins
|
111
|
46
|
62
|
39
|
|
Visiting team wins
|
72
|
55
|
51
|
41
|
Question 13:
The data in the accompanying table summarizes results from tests of the accuracy of mammograms. Use a 0.05 significance level to test the claim that whether the subject has a tumor is independent of the mammogram indication. What do the results suggest about the effectiveness of mammograms?
| |
Mammogram Indicated Tumor |
No Tumor |
| Subject had a tumor |
13 |
44 |
| Subject did not have a tumor |
18 |
23 |
Are mammograms effective?
A. Yes, there is not sufficient evidence to reject the claim of independence.
B. No, there is sufficient evidence to reject the claim of independence.
C. No, there is not sufficient evidence to reject the claim of independence.
D. Yes, there is sufficient evidence to reject the claim of independence.
Question 14:
Below are the results of a trial involving an experimental vaccine for children.
| |
Developed flu |
Did not develop flu |
| Vaccine treatment |
14 |
95 |
| Placebo |
1056 |
437 |
Use a 0.05 significance level to test for independence between the columns and rows.
Does the vaccine appear to be effective question mark
A. Yes, because the test statistic is less than the critical value.
B. No, because the test statistic is less than the critical value.
C. Yes, because the test statistic is greater than the critical value.
D. No comma because the test statistic is greater than the critical value.
Question 15:
This table summarizes results from an experiment in which subjects were first classified as smokers or nonsmokers, then they were given a treatment, then later they were again classified as smokers or nonsmokers. How many subjects appear to be unaffected by the treatment one way or the other?
Before Treatment
Smoke Don't Smoke
|
After Treatment
|
Smoke 414 8
Don't Smoke 358 174
|
How many subjects were unaffected?
Question 16:
Subjects have athlete's foot on each of their feet. For each subject, one foot is given a fungicide, the other a placebo. Using a 0.05 significance level, test the effectiveness of the treatment.
|
|
Fungicide Treatment
|
|
Cure
|
No Cure
|
|
Placebo
|
Cure
|
9
|
20
|
|
No Cure
|
24
|
45
|
Is there sufficient evidence to conclude that the fungicide is effective? Why? Choose the correct answer below.
A. No, because the test statistic does not exceed the critical value.
B. No, because the test statistic exceeds the critical value.
C. Yes, because the test statistic exceeds the critical value.
D. Yes, because the test statistic does not exceed the critical value.
Attachment:- Table of critical values for the correlation coefficient.pdf