Question 1. True or False. Justify for full credit.
(a) If A and B are disjoint, P(A) = 0.4 and P(B) = 0.5, then P(A AND B) = 0.2.
(b) If all the observations in a data set are identical, then the variance for this data set is zero.
(c) There may be more than one mode in a data set.
(d) A 95% confidence interval is wider than a 98% confidence interval of the same parameter.
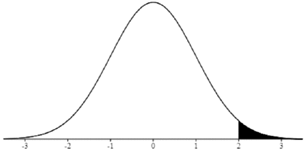
(e) In a two-tailed test, the value of the test statistic is 2. The test statistic follows a distribution with the distribution curve shown below. If we know the shaded area is 0.03, then we have sufficient evidence to reject the null hypothesis at 0.05 level of significance.
Question 2. Choose the best answer. Justify for full credit.
(a) The quality control department of a semiconductor manufacturing company tests every 100th product from the assembly line. This type of sampling is called:
(i) cluster
(ii) convenience
(iii) systematic
(iv) stratified
(b) A study was conducted at a local college to analyze the trend of average GPA of all students graduated from the college. According to the Registrar, the average GPA for students with economics major from the class of 2016 is 3.5. The value 3.5 is a
(i) statistic
(ii) parameter
(iii) cannot be determined
(c) The hotel ratings are usually on a scale from 0 star to 5 stars. The level of this measurement is
(i) interval
(ii) nominal
(iii) ordinal
(iv) ratio
(d) 600 students took a chemistry test. You sampled 100 students to estimate the average score and the standard deviation. How many degrees of freedom were there in the estimation of the standard deviation?
(i) 599
(ii) 600
(iii) 99
(iv) 100
(e) You choose an alpha level of 0.05 and then analyze your data. What is the probability that you will make a Type I error given that the null hypothesis is true?
(i) 0.01
(ii) 0.025
(iii) 0.05
(iv) 0.10
Question 3. A random sample of 200 students was chosen from UMUC STAT 200 classes. The frequency distribution below shows the distribution for study time each week (in hours). (Show all work. Just the answer, without supporting work, will receive no credit.)
|
Study Time (in hours)
|
Frequency
|
Relative Frequency
|
|
0.0 - 5.0
|
6
|
|
|
5.1 - 10.0
|
24
|
|
|
10.1 - 15.0
|
50
|
|
|
15.1 - 20.0
|
|
0.35
|
|
20.1 - 25.0
|
|
|
|
Total
|
200
|
|
(a) Complete the frequency table with frequency and relative frequency. Express the relative frequency to two decimal places.
(b) What percentage of the study times was at most 15 hours?
(c) In what class interval must the median lie? 5.1 - 10.0, 10.1 -15.0, 15.1 - 20.0, or 20.1 - 25.0?
Why?
Question 4. The five-number summary below shows the grade distribution of a STAT 200 quiz for a sample of 500 students.
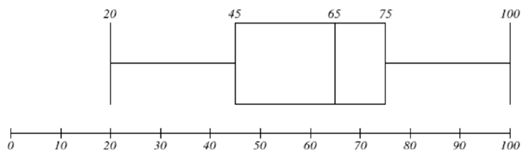
Answer each question based on the given information, and explain your answer in each case.
(a) What is the minimum in the grade distribution?
(b) Which quarter has the smallest spread of data? What is that spread?
(c) Find the interquartile range (IQR) in the grade distribution.
(d) Are there more students in the score band of 20 - 40 or 60 - 80? Why?
(e) Can the average score be determined based on the given information? Why or why not?
Question 5. A basket contains 2 white balls, 5 yellow balls, and 3 red balls. Consider selecting one ball at a time from the basket. (Show all work. Just the answer, without supporting work, will receive no credit.)
(a) Assuming the ball selection is with replacement. What is the probability that the first ball is red and the second ball is yellow?
(b) Assuming the ball selection is without replacement. What is the probability that the first ball is red and the second ball is also red?
Question 6. There are 1500 juniors in a college. Among the 1500 juniors, 600 students are taking STAT200, and 800 students are taking PSYC300. There are 500 students taking both courses. Let S be the event that a randomly selected student takes STAT200, and P be the event that a randomly selected student takes PSYC300. (Show all work. Just the answer, without supporting work, will receive no credit.)
(a) Provide a written description of the complement event of (S OR P).
(b) What is the probability of complement event of (S OR P)?
Question 7. Consider rolling a fair 6-faced die twice. Let A be the event that the sum of the two rolls is at most 4, and B be the event that the first one is an odd number.
(a) What is the probability that the sum of the two rolls is at most 4 given that the first one is an odd number? Show all work. Just the answer, without supporting work, will receive no credit.
(b) Are event A and event B independent? Explain.
Question 8. Answer the following two questions. (Show all work. Just the answer, without supporting work, will receive no credit).
(a) Mimi has seven books from the Statistics is Fun series. She plans on bringing three of the seven books with her in a road trip. How many different ways can the three books be selected?
(b) A combination lock uses three distinctive numbers between 0 and 49 inclusive. How many different ways can the sequence of three numbers be selected?
Question 9. Imagine you are in a game show. There are 30 prizes hidden on a game board with 100 spaces. One prize is worth $100, nine are worth $50, and another twenty are worth $10. You have to pay $10 to the host if your choice is not correct. Let the random variable x be the money you get or lose. Show all work. Just the answer, without supporting work, will receive no credit.
(a) Complete the following probability distribution.
(b) What is your expected winning or loss in this game? Be specific in your answer whether it's winning or loss.
Question 10. Mimi joined UMUC basketball team in spring 2017. On average, she is able to score 30% of the field goals. Assume she tries 15 field goals in a game.
(a) Let X be the number of field goals that Mimi scores in the game. As we know, the distribution of X is a binomial probability distribution. What is the number of trials (n), probability of successes (p) and probability of failures (q), respectively?
(b) Find the probability that Mimi scores at least 3 of the 15 field goals. (round the answer to 3 decimal places) Show all work. Just the answer, without supporting work, will receive no credit.
Question 11. A research concludes that the number of hours of exercise per week for adults is normally distributed with a mean of 4 hours and a standard deviation of 3 hours. Show all work. Just the answer, without supporting work, will receive no credit.
(a) What is the probability that a randomly selected adult has more than 7 hours of exercise per week (round the answer to 4 decimal places)
(b) Find the 80th percentile for the distribution of exercise time per week. (round the answer to 2 decimal places)
Question 12. Assume the SAT Mathematics Level 2 test scores are normally distributed with a mean of 500 and a standard deviation of 100. Show all work. Just the answer, without supporting work, will receive no credit.
(a) Consider all random samples of 64 test scores. What is the standard deviation of the sample means? (Round your answer to three decimal places)
(b) What is the probability that 64 randomly selected test scores will have a mean test score that is greater than 525? (Round your answer to four decimal places)
Question 13. A city built a new parking garage in a business district. For a random sample of 100 days, daily fees collected averaged $2,500, with a standard deviation of $500. Construct a 90% confidence interval estimate of the mean daily income this parking garage generates. Show all work. Just the answer, without supporting work, will receive no credit.
Question 14. Mimi conducted a survey on a random sample of 100 adults. 70 adults in the sample chose banana as his / her favorite fruit. Construct a 95% confidence interval estimate of the proportion of adults whose favorite fruit is banana. Show all work. Just the answer, without supporting work, will receive no credit.
Question 15. A researcher is interested in testing the claim that more than 75% of the adults believe in global warming. She conducted a survey on a random sample of 400 adults. The survey showed that 320 adults in the sample believe in global warming.
Assume the researcher wants to use a 0.05 significance level to test the claim.
(a) Identify the null hypothesis and the alternative hypothesis.
(b) Determine the test statistic. Show all work; writing the correct test statistic, without supporting work, will receive no credit.
(c) Determine the P-value for this test. Show all work; writing the correct P-value, without supporting work, will receive no credit.
(d) Is there sufficient evidence to support the claim that more than 75% of adults believe in global warming? Explain
Question 16. In a study of memory recall, 5 people were given 10 minutes to memorize a list of 20 words. Each was asked to list as many of the words as he or she could remember both 1 hour and 24 hours later. The result is shown in the following table.
|
|
Number of Words Recalled
|
|
Subject
|
1 hour later
|
24 hours later
|
|
1
2
3
4
5
|
13
18
10
15
11
|
12
16
9
13
11
|
Is there evidence to suggest that the mean number of words recalled after 1 hour exceeds the mean recall after 24 hours? Assume we want to use a 0.05 significance level to test the claim.
(a) Identify the null hypothesis and the alternative hypothesis.
(b) Determine the test statistic. Show all work; writing the correct test statistic, without supporting work, will receive no credit.
(c) Determine the P-value. Show all work; writing the correct P-value, without supporting work, will receive no credit.
(d) Is there sufficient evidence to support the claim that the mean number of words recalled after 1 hour exceeds the mean recall after 24 hours? Justify your conclusion.
Question 17. John oversees a bottle-filling machine in a company. The amount of fluid dispensed into each bottle is approximately normally distributed with an unknown population standard deviation. On a particular day, a random sample of 50 bottles yielded a mean of 357.2 ml and a standard deviation of 15.8 ml. John then concluded that the population standard deviation of the fluid dispense amount by the machine is greater than 15 ml.
The lead engineer wants to use a 0.01 significance level to test John's claim.
(a) Identify the null hypothesis and alternative hypothesis.
(b) Determine the test statistic. Show all work; writing the correct test statistic, without supporting work, will receive no credit.
(c) Determine the P-value for this test. Show all work; writing the correct P-value, without supporting work, will receive no credit.
(d) Is there sufficient evidence to support John's claim that the population standard deviation of the fluid dispense amount by the machine is greater than 15 ml? Explain.
Question 18. The UMUC Daily News reported that the color distribution for plain M&M's was: 40% brown, 20% yellow, 20% orange, 10% green, and 10% tan. Each piece of candy in a random sample of 100 plain M&M's was classified according to color, and the results are listed below. Use a 0.05 significance level to test the claim that the published color distribution is correct. Show all work and justify your answer.
|
Color
|
Brown
|
Yellow
|
Orange
|
Green
|
Tan
|
|
Number
|
42
|
21
|
12
|
7
|
18
|
(a) Identify the null hypothesis and the alternative hypothesis.
(b) Determine the test statistic. Show all work; writing the correct test statistic, without supporting work, will receive no credit.
(c) Determine the P-value. Show all work; writing the correct P- value, without supporting work, will receive no credit.
(d) Is there sufficient evidence to support the claim that the published color distribution is correct? Justify your answer.
Question 19. A STAT 200 instructor believes that the average quiz score is a good predictor of final exam score. A random sample of 10 students produced the following data where x is the average quiz score and y is the final exam score.
|
x
|
72
|
94
|
55
|
63
|
100
|
40
|
85
|
70
|
75
|
85
|
|
y
|
70
|
96
|
50
|
70
|
96
|
50
|
83
|
75
|
77
|
87
|
(a) Find an equation of the least squares regression line. Show all work; writing the correct equation, without supporting work, will receive no credit.
(b) Based on the equation from part (a), what is the predicted final exam score if the average quiz score is 80? Show all work and justify your answer.
Question 20. A study of 15 different weight loss programs involved 300 subjects. Each of the 15 programs had 20 subjects in it. The subjects were followed for 12 months. Weight change for each subject was recorded. We want to test the claim that the mean weight loss is the same for the 15 programs.
(a) Complete the following ANOVA table with sum of squares, degrees of freedom, and mean square (Show all work):
|
Source of Variation
|
Sum of Squares
(SS)
|
Degrees of Freedom
(4f)
|
Mean Square
(318)
|
|
Factor
(Between)
|
42.5
|
|
|
|
Error
(Within)
|
|
|
|
|
Total
|
553.05
|
299
|
N/A
|
(b) Determine the test statistic. Show all work; writing the correct test statistic, without supporting work, will receive no credit.
(c) Determine the P-value. Show all work; writing the correct P-value, without supporting work, will receive no credit.
(d) Is there sufficient evidence to support the claim that the mean weight loss is the same for the 15 programs at the significance level of 0.10? Explain.