Quantitative Methods for Business SAIBT Assignment -
Question 1 -
Joe Bright, the marketing manager for Mountain Mist soda needs to decide how many TV spots and magazine advertisements to run during the next quarter. Each TV spot costs $5,000 and is expected to increase sales by 300,000 cans. Each magazine advertisement costs $2,000 and is expected to increase sales by 500,000 cans. The total soda advertising budget for the next quarter is set at $100,000; however Mountain Mist wants to spend no more than $70,000 on TV spots and no more than $50,000 on magazine ads. Mountain Mist earns a profit of 5 cents on each can of soda it sells. Joe has decided to use linear programming to find the most profitable mix of advertisements. He asks for your help.
(a) What are the decision variables for this problem?
(b) Using decision variables identified in part (a), formulate the objective function for this problem. Is the quantity of interest to be maximized or minimized?
(c) What is the limited resource in this problem? Using decision variables from part (a), formulate the constraint for this resource.
(d) What other constraints are relevant to this problem? Using the decision variables from part (a), formulate those constraints.
(e) Give the full mathematical model for this problem.
(f) Use EXCEL Solver to obtain a solution to the linear programming problem from part (e), together with an Answer Report and a Sensitivity Report. Provide a printout of your EXCEL spreadsheet and of the two Excel reports with your assignment submission.
(g) Mountain Mist's major competitor has just launched its new TV advertising campaign. Joe worries that Mountain Mist's TV spots will be less effective and only increase sales by 200,000 cans. Would the solution obtained in part (f) still be optimal? Which of the EXCEL reports helps you answer this question? Justify your answer carefully. How would Mountain Mist's total profit change, if at all?
(h) Prepare a report that summarizes linear programming results. Your report should discuss the following issues:
- The optimal number of TV spots and magazine advertisements and the maximum increase in profit next quarter.
- The actual cost of Mountain Mist's advertising and the amount left in the budget, if any.
- The total cost of the optimum number of TV spots, and of the magazine advertisements.
- Which report enables you to answer these questions?
(i) What is the impact on the maximum profit if the budget is increased by $10,000. Include in your answer a discussion of the shadow price.
Question 2 -
A sample of 500 respondents was selected in a large metropolitan area to determine information concerning consumer behaviour. The following contingency table was obtained:
|
Enjoys shopping for clothing
|
Gender
|
|
Male
|
Female
|
Total
|
|
Yes
|
136
|
224
|
360
|
|
No
|
104
|
36
|
140
|
|
Total
|
240
|
260
|
500
|
(a) Produce a stacked column chart of these variables to highlight the difference in attitude between men and women.
A respondent is chosen at random.
(b) What is the probability that the respondent:
(i) is female;
(ii) does not enjoy shopping for clothing;
(iii) is male and does not enjoy shopping for clothing;
(iv) is female or does not enjoy shopping for clothing.
(c) Suppose the respondent chosen enjoys shopping for clothing. What, then, is the probability that the individual is a male?
(d) Are enjoying shopping for clothing and gender of the individual statistically independent? Explain your answer carefully.
Question 3 -
Problems with a telephone line that prevent a customer from receiving or making calls are disconcerting to both the customer and the telephone company. These problems can be of two types: those that are located inside a central office and those located on lines between the central office and the customer's equipment. The following data represent samples of 20 problems reported to two different offices of a telephone company and the time to clear those problems (in minutes).
|
Central Office I
|
Time to clear problems (minutes)
|
|
2.52
|
0.78
|
0.93
|
1.02
|
1.48
|
1.60
|
1.75
|
2.97
|
3.93
|
5.45
|
|
0.53
|
0.80
|
0.97
|
1.05
|
1.48
|
1.60
|
2.85
|
3.10
|
4.15
|
6.32
|
(a) Use EXCEL to obtain a histogram for the central office location.
EXCEL Instructions: Please refer to Topic 6 in the Excel Booklet for instructions on how to obtain and format a histogram. Please use the bins given in 1 minute intervals.
(b) Use EXCEL to obtain Descriptive Statistics, Quartile 1 and Quartile 3 for the central office location.
EXCEL Instructions: Please refer to Topic 7 in the Excel Booklet for instructions on how to obtain Descriptive Statistics and the two quartiles.
(c) Based on the histogram in (a), briefly describe the shape (symmetry, modality and outliers) of the data for the central office location.
(d) Which measures of location and dispersion should you use to describe the data for the central office location? What are their values? Give a brief explanation for your choice.
Question 4 -
Three entrepreneurial women open a shop selling high-quality second-hand children's clothing, toys, and furniture. Items are consigned to the shop by individuals who then receive a percentage of the selling price of their items. Daily data for April 2004 was recorded, including each day's gross sales, broken down by the method of payment (cash or credit card). 'Gross sales' in retailing are overall dollar sales, not adjusted for returns or discounts. The data record the number of items sold and the dollar amount of gross sales for each payment method on the day. The three owners are interested in the relationship between the amount and the number of items sold for cash purchases.
The scatterplot of the data, together with the equation of a fitted regression line, is shown below.
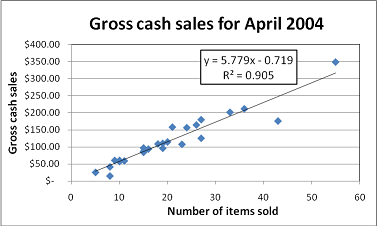
(a) Identify the independent variable and the dependent variable in this example? What type of variables are they?
(b) What is the value of the slope and what does it mean in this example?
(c) What is the value of the intercept and what does it mean in this example?
(d) What is the value of the coefficient of determination and what does it mean in this example?
(e) Use the model described above to predict gross cash sales if 70 items are sold in a day. Is this prediction likely to be accurate? Explain briefly.
Question 5 -
Inspectors have chosen twenty (20) packets of Jolly Jubes at random, and weighed them. The mean weight of the packets is 181.2 grams, with a standard deviation of 3.2 grams.
(a) Use this data to construct and interpret a 99% confidence interval for the mean weight of a packet of Jolly Jubes.
(b) Is it possible to retain 99% confidence whilst reducing the margin of error in the confidence interval? Explain briefly (you may quote a relevant formula to support your explanation)
(c) Assuming 99% confidence, and a standard deviation of 3.2 grams, what is the sample size required to estimate, to within 1 gram, the population mean weight of a packet of Jolly Jubes?
(d) Packets of Jolly Jubes are labelled as containing 180 grams of the flavourful confection. From the sample of 20 packets described above, and at the 0.05 level of significance, is there evidence that the mean weight of a packet is different from 180 grams?
Show all 5 steps.