Purpose of Assignment
The purpose of this assignment is to provide students hands-on experience with summarizing raw data using graphs and charts and interpreting results.
Students will also use Excel Pivot Tables and Pivot Charts to summarize raw data. In the era of big data, tools like Pivot Tables and PowerPivot are critical tools to summarize the data.
Assignment Steps
Complete the five exercises on the Microsoft Excel file, "Graphical Techniques Template."
Note: Detailed instructions for the first four questions are provided in the document, "Graphical Techniques Instructions."Graphical Techniques Instructions
Question 1
Step 1: Select the entire table including the headings. Make sure you also select the headings (Projection TV, LCD TV, Plasm. TV).
Step 2: Click on the Insert tab on the top of Excel.
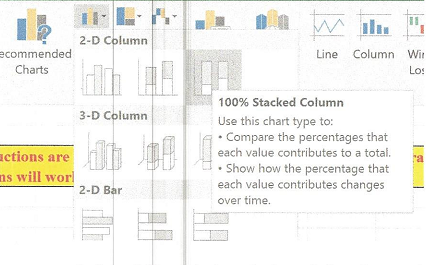
Step 3: Click on the column ch drop Own.
Step 4: Select 100% stacked collimn chart.

Step 5: Make sure you get the legend. If you don't get the legend, then please go back to Step 1 above and select the titles AND the data.
Step 6: Give a brief and sensible title to the chart.
Step 7: Optional - Label your Y-axis. Make sure you have ($ thousands) as units.
Question 2
Step 1: Select the entire table including the headings.
Step 2: Click on the Insert tab on the top of Excel.
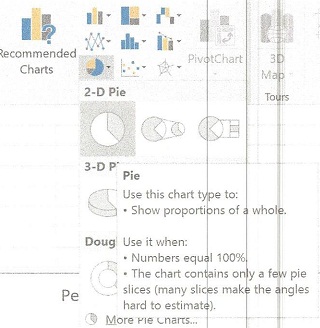
Step 3: Click on the Pie Chart option

Step 4: Once the pie chart gets displayed, right-click on the pie chart and select "Add Data Labels".
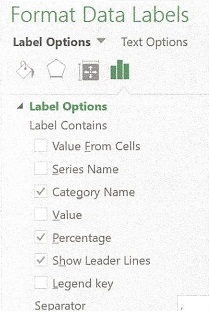
Step 5: You will see the numbers on the pieces of the pie chart. Right-click these numbers and select "Format Data Labels".

Step 6: Under "Format Data Labels", check mark only the Category Name, Percentage, and Show Leader Lines. Uncheck the Value box
Step 7: Close the "Format Data Labels' box.
Step 8: Delete the legend at the bottom of the pie chart.
Instructions for Question 3
Steps for creatin a Pivot Table
Step 1: Click on any one rating.
Step 2: Click on the Insert tab on the top of Excel.
Step 3: Click on PivotTable to the left.
Step 4: In the Create PivotTable window , click OK.
Step 5: In the PivotTable fields, drag the Restaurant Ratings to Rows.
Step 6: In the PivotTable fields, drag the Restaurant Ratings to Values.
Step 7: Close the Pivot fields box on the right.
Step 8: Right-click any number on the pivot table.
Step 9: Click on Sort.
Step 10: Click on From Largest to Smallest.
Step 11: Rename the columns.
Steps for creating a Pivot Bar Chart
Step 1: Click anywhere inside the pivot table
Step 2: On the right, click on Pivot Chart
Step 3: Click on Column or Bar on the Insert Chart window.
Step 4: Click OK to close the Insert Chart window.
Steps for creating a Pivot Pie Chart
Step 1: Click anywhere inside the pivot table
Step 2: On the right, click on PivotChart
Step 3: Click on Pie on the Insert Chart window
Step 4: Click OK to close the Insert Chart window.
Step 5: Right-click on the pie chart.
Step 6: Select Add Data Labels.
Step 7: Right-click on the numbers in the pieces of the pie.
Step 8: Select Format Data labels
Step 9: Check the Category and percentage boxes.
Step 10: Uncheck the Value box.
Instructions for Question 4
Step 1: Select the entire table Make sure you select the headings too.
Step 2: Click on the Insert tab on the Excel ribbon.
Step 3: Click on the line chart.
Step 4: The line chart should be plotted.