Problems -
1. Many policy researchers are interested in the factors that are causally related to vehicle fatalities in U.S. states. We can begin an analysis of these factors by examining the simple factor of population density. We might expect that sparsely populated states will experience more vehicle fatalities per year, simply because residents must travel further in their everyday lives.
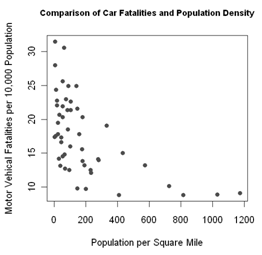
Take a look at the scatterplot below, which plots vehicle fatalities against population density (each dot is a U.S. state). Looking at the graph, is the correlation between these two variables positive or negative? Explain what a positive or negative correlation means in this context.
2. After examining the relationship between these two variables, a logical next step would be to calculate a bivariate regression in which vehicle fatalities is the dependent variable and population density is the independent variable.
In the sample regression function below, vehicle fatalities is measured in number of fatalities per 10,000 people and density is the population per square mile.
vehicle fatalities = 19.9 - .013 density
(0.836) (0.002)
a. Interpret the intercept in this regression.
b. Does the intercept have real-world meaning in this case? Explain.
c. Interpret the slope coefficient in this regression.
d. Provide an interpretation of the slope coefficient that assumes an increase in the independent variable of 1000 units.
e. Is there a statistically significant relationship between a state's population density and vehicle fatalities in that state? In your answer state the null hypothesis, the alternative hypothesis, the t-statistic and the result of the hypothesis test. Perform this test that the 5% significance level.
f. What is the predicted number of vehicle fatalities in a state (per 10,000) that has a population density of 300 people per square mile?
3. For this section, you will use the states_new.csv dataset and R to answer the questions.
It is widely accepted that alcohol use contributes to vehicle fatalities. Policymakers frequently debate whether new alcohol-related laws (such as higher taxes and stiffer drunk driving penalties) may reduce vehicle fatalities.
This section asks you to estimate a regression model that identifies the precise effect of beer consumption on vehicle fatalities in U.S. states. In your model, you will control for each state's population density. Table 1 provides definitions for the variables you will use in this dataset.
Table 1: Relevant Variable Definitions
|
Variable
|
Definition
|
|
carfatal
|
Motor vehicle fatalities per 10,000 population in each state (from the U.S. Census Bureau)
|
|
density
|
Population per square mile in each state (from the U.S. Census Bureau)
|
|
beer_pc
|
Average yearly per capita beer consumption in gallons (from the National Institute on Alcohol Abuse and Alcoholism)
|
a. Estimate the following population regression in R:
vehicle fatalities = β0 + β1 population density + β2 beer consumption + e
Write out the sample regression (including standard errors).
b. Interpret the intercept in the sample regression function.
c. Interpret the coefficient population density in the sample regression function.
d. Interpret the coefficient on beer consumption in the sample regression function.
e. Perform a hypothesis test to determine if there is a statistically significant relationship (at the 5% significance level) between beer consumption and alcohol fatalities in U.S. states. In your answer, state the null hypothesis, alternative hypothesis, t-statistic and result of the hypothesis test.
f. What is the predicted number of vehicle fatalities in a state that has a population density of 315 people per square mile and the average per capita beer consumption is 1 gallon?
g. What is the predicted number of vehicle fatalities in a state that has a population density of 96 people per square mile and the average per capita beer consumption is 1.7 gallons?
h. This model allows you to determine the effect of beer consumption on vehicle fatalities while controlling for population density. By controlling for population density, we ensure that the relationship we uncover between beer consumption and vehicle fatalities is not driven by this variable.
For example, someone may argue that people who live in populous states are more likely to consume beer, because there are bars and social opportunities. If that were the case, then a relationship between beer consumption and vehicle fatalities might be spurious - this relationship might be driven by population density. By controlling for this variable, we ensure that the effect of beer consumption does not include the effect of population density on vehicle fatalities.
Provide an example of another variable that would be useful to include as a control variable. In other words, what is another variable that might further improve the model by allowing us to estimate an even more accurate effect of beer consumption on vehicle fatalities? Explain.
R Code: Paste your code here.
Attachment:- Assignment Files.rar