Part I - Multiple choices
For the following questions, select the single? best answer.
Q1. A random sample of 50 records yields a 95% confidence interval for the mean age at first marriage of women in a certain county of 21.5 and 23.0 years. Which of the following represents an incorrect?interpretation of a 95% confidence interval?
a. In repeated samples, 95% of the confidence intervals will cover the population mean age.
b. We are 95% confident that the population means age lies between 21.5 and 23.0 years.
c. In repeated samples, 95% of the sample means will fall within the confidence interval.
d. We are 95% confident that the interval (21.5, 23.0) covers the population mean age.
Q2. Anthropologists often try to reconstruct information using partial human remains at burial sites. For instance, after finding a femur, they may want to predict how tall in individual was. An equation they use to do this is E(Y) = 61.4 + 2.4 X, where E(Y) is the mean height and X is the length of the femur, both in centimeters. Which of the following is not? ?true:
a. The predicted height of someone with a femur length of 50 centimeters is 61.4 + 2.4 * 50.
b. The mean height of someone with a 0 centimeter femur is 61.4 centimeters.
c. The change in mean height for a one centimeter change in femur length is 2.4 centimeters.
d. The change in mean femur length for a one centimeter change in height is 2.4 centimeters.
Q3. We fitted 3 multiple linear regression models to our data. Model 1 had an R2 of 0.87 and an adjusted R2 of 0.86. Model 2 had an R2 of 0.95 and an adjusted R2 of 0.81. Model 3 had an R2 of 0.95 and an adjusted R2 of 0.75. Without other information, which model seems to be the best choice, balancing model fit with the size of the model:
a. Model 1
b. Model 2
c. Model 3
d. Model 2 and Model 3 are equally good choices.
Q4. We conduct a t-test comparing mean total cholesterol between men and women and obtain a p-value of 0.04. Which of the following is correct:
a. The probability of seeing a difference in mean total cholesterol between men and women as or more extreme than we observed is 0.04, given there is no difference in mean total cholesterol between men and women.
b. The probability of seeing a difference in mean total cholesterol between men and women as or more extreme than we observed is 0.04, given there is a difference in mean total cholesterol between men and women.
c. The probability that there is a difference in mean total cholesterol between men and women is 0.04.
d. The probability of a Type I error is 0.04, specifically it is the probability that we incorrectly reject the null hypothesis when the null hypothesis is true.
Q5. Ten patients with advanced diabetic nephropathy (kidney complications of diabetes) were treated with captopril over an 8-week period. Urinary protein (measured in grams per 24 hours) was collected before and after drug therapy. Why is a paired? t-test the appropriate statistical procedure to test whether mean urinary protein has changed over the 8-week period?
a. We want to observe differences in urinary protein between drug therapy groups.
b. Urinary protein measurements taken from an individual before and after drug therapy are not independent.
c. There are only 10 patients, so the central limit theorem does not apply.
d. Urinary protein is a binary variable.
Q6. A study of children's schooling reported the prediction equation: logit(P(Y = 1)) = 0.75 + 0.35 [year of birth] + 0.13 [father's education] + 0.09 [mother's education], where Y = 1 if the child obtains a high school degree and 0 otherwise. What is the correct interpretation of the coefficient of mother's education, 0.09?
a. The odds ratio of obtaining a high school degree for a one year increase in mother's education.
b. The log odds ratio of obtaining a high school degree for a one year increase in mother's education when year of birth and father's education are both zero.
c. The log odds ratio of obtaining a high school degree for a one year increase in mother's education, controlling for year of birth and father's education.
d. The odds ratio of obtaining a high school degree for a one year increase in mother's education, controlling for year of birth and father's education.
Q7. Suppose we fitted the following model: logit(P( Y = 1 )) = α + β X, where X is age in years and Y is a binary variable with 1 = "dead" and 0 = "alive". Which of the following is not? true:
a. exp(β) is the odds ratio of death for a one year increase in age.
b. exp(β) / (1 + exp(β)) is the probability of death for a one year increase in age.
c. β represents the association between age and death.
d. β is the difference in odds of death for a one year increase in age.
Q8. Which of the following is not? true about ANCOVA models:
a. They can be viewed as combining simple linear regression and one-way ANOVA.
b. They test the differences in the mean of a continuous variable across groups, controlling for a categorical variable.
c. ANCOVA can be performed using a multiple linear regression model with a continuous and a categorical predictor.
d. ANCOVA models should never be fitted to nominal categorical data.
Q9. Suppose you were interested in determining what factors were associated with daily counts of mortality. What type of analysis should you conduct?
a. Poisson regression
b. Logistic regression
c. Linear regression
d. T-test
Q10. Suppose we are interested in determining whether exposure to particulate matter chemical components is associated with mortality. We test associations between mortality and each of the following pollutants individually: aluminum, silicon, ammonium ion, nitrate, sulfate, zinc, nickel, and magnesium. If we want to control for multiple comparisons and we want the overall significance level α = 0.05, what value should we compare our p-values to?
a. 0.05 * 8 = 0.4
b. 0.05
c. 0.05 / 5 = 0.01
d. 0.05 / 8 = 0.006
Q11. Medical tests for diagnosing conditions such as breast cancer are fallible, just like decisions in significance tests. Suppose the null hypothesis, H0 true, means that the disease is absent. Therefore, H0 false means that the disease is present. The corresponding medical test could be positive (reject H0) or negative (fail to reject H0). Which of the following is not? true:
a. A Type I error occurs when the test is positive, but disease is absent.
b. Statistical power is the probability of a positive test when the disease is present.
c. The probability of a Type II error is the significance level, α, and is generally set to be 0.05.
d. A Type II error occurs when the test is negative, but disease is present.
Q12. Suppose we collect a sample of 100 GMU students and we are interested in testing whether the percentage of women among all college students is 50%. Our sample contains 48% women. Which of the following is an appropriate test statistic?
a. Z = (0.48 - 0.5) / SE where SE = √(0.5 × 0.5)
b. Z = (48 - 50) / SE where SE = √(48 × (1 - 48))
c. Z = (0.48 - 0.5) / SE where SE = √(0.5 × 0.5) / 100)
d. Z = (48 - 50) / SE where SE = √(48 × (1 - 48) / 100)
Q13. In the model log(E(Y)) = α + β X, which of the following is a correct interpretation of β:
a. The log relative risk of Y for a unit increase in X.
b. The relative risk of Y for a unit increase in X.
c. The difference in log risk of X for a unit increase in Y.
d. The log odds ratio of Y for a unit increase in X.
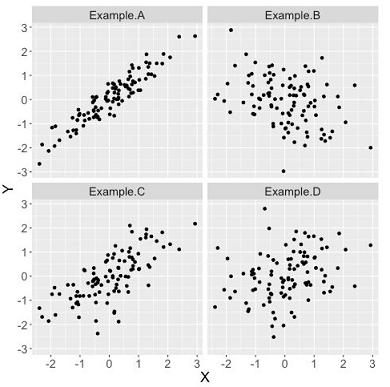
Q14. Of the four plots below, which shows a correlation equal to 0.5?
a. Example A
b. Example B
c. Example C
d. Example D
Q15. Which of the following is not a correct way of writing the null hypothesis for an F-test that compares mean age across three racial groups:
a. H0: μ?1?= μ?2?= μ?3?=0
b. H0: μ?1- μ?2?=0
c. H0: β1= β2=0
d. H0: ?There is no association between age and race.
Part II - Short essay
From the results from Models A-J on the following pages, summarize the main findings. Your report must be:
- Double spaced
- 2 pages
- Typed
- 12 point Times New Roman (or similar) font
- 1 inch margins
You have creative freedom to select and highlight the results you find most compelling. Your essay will be graded according to the provided rubric. Please review the rubric carefully.
Dataset:
This dataset is from a study of 1000 patients as part of Phase I of SUPPORT (Study to Understand Prognoses Preferences Outcomes and Risks of Treatment).
Variables:
death:
age: Age in years
racec:
- 1: White
- 2: Black
- 3: Asian
- 4: Other
- 5: Hispanic
sexc:
num_co: Number of comorbidities (numeric, treat as continuous)
scoma: Coma score (numeric, treat as continuous. Lower scores indicate deeper unconsciousness)
Attachment:- Assignment File.rar