Ask Question, Ask an Expert

+61-413 786 465

info@mywordsolution.com

Ask Applied Statistics Expert

Midterm Exam - Untimed Component

Answers to discussion questions should be brief and concise.

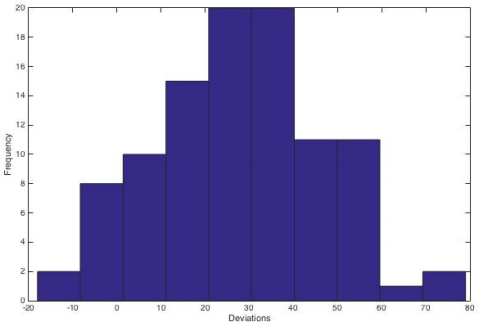
The manager of a distribution center is concerned about delivery times associated with transporting materials to customers. In particular, deviations from the estimated travel time are of interest. Late arrivals cause financial penalties whereas early arrivals cause customer dissatisfaction due to congestion in the shipping areas and lost opportunity for the distribution center. A random sample of 100 recent deliveries is taken. The deviation in actual delivery time and estimated delivery time is calculated as Deviations = actual time - estimated time.

1. A graphical summary is provided below. Give a brief description of the results.
42_figure.png

2. If a calculated deviation (D) is positive, was the delivery late or early?

3. Each day hundreds of deliveries are scheduled. The manager decides to monitor the time deviations by taking a random sample of 16 deliveries and calculating the average deviation defined by D- = 1/16 i=116 Di for each day. Assume that historical data such as that displayed in part (1) suggests that the distribution of deviations Di have a mean of 27 minutes and a standard deviation of 20 minutes. Find the probability that the sample mean is less than 15 minutes. (i.e. Find P[D- < 15] for a sample of size n=16).

4. A supervisor suggests that the old computer program for estimating delivery times (used in problems 1-3) be abandoned. Instead, schedulers could use an alternative such as MapQuest to estimate driving times. As a pilot study, 500 recent deliveries were randomly selected. The Excel file named Midterm 2018 Data.xls contains the following variables:

Actual Times: actual time required to make delivery

Old Model Deviations: difference in actual delivery time and predicted delivery time using old computer prediction model

MapQuest: predicted delivery times for the randomly selected routes using MapQuest

Use the data to calculate the deviations for the MapQuest estimates

(DMapQuest = actual delivery time - MapQuest predicted delivery time), then construct an appropriate graph for comparing the deviations for the Old Computer model and the MapQuest model. Interpret the results and indicate which prediction model should be used in the future. (Do NOT include the calculated deviations here. Do include the graph and interpretation.)

5. A driver reads your answer to part (4) and makes the following comment:

MapQuest gives driving times for cars. Driving times for trucks will probably be longer because we can't go as fast, especially in city traffic. Is there some way to adjust the MapQuest prediction to make it fit trucks better?

Construct a fitted line plot (scatterplot with fitted linear regression line) using the MapQuest times as the predictor variable and the actual times as the response variable. Call the fitted values 'Adjusted MapQuest' times. Provide the fitted line plot, regression equation and R2 values associated with the 'Adjusted MapQuest' times. Interpret your results and indicate whether the driver's suggestion is valid or invalid.

6. Use the regression equation given in part (5) to provide 'Adjusted MapQuest' times for the sample of 500 deliveries and calculate the Adjusted Deviations = Actual times - Adjusted MapQuest times. (You do NOT need to put those values here.) Construct an appropriate graph for comparing the deviations associated with the Old Computer Model, the MapQuest model and Adjusted MapQuest model and include it here. Interpret the graph and recommend the modeling tool (method of predicting delivery times) you feel is most accurate.

Attachment:- Data File.rar

Applied Statistics, Statistics

  • Category:- Applied Statistics
  • Reference No.:- M92718473
  • Price:- $90

Guranteed 48 Hours Delivery, In Price:- $90

Have any Question?


Related Questions in Applied Statistics

Business data analysis facts from figures assignment

BUSINESS DATA ANALYSIS: FACTS FROM FIGURES Assignment - Question 1 - Private capital expenditure for 12 successive quarters are presented in the following table: Quarter Millions     1 31,920 2 25,120 3 30,350 4 24,650 5 ...

Assessment task -you become interested in the non-skeletal

Assessment Task - You become interested in the non-skeletal effects of vitamin D and review the literature. On the basis of your reading you find that there is some evidence to suggest that vitamin D deficiency is linked ...

Enhancing patient safety through organizational learningare

Enhancing Patient Safety through Organizational Learning: Are Patient Safety Indicators a Step in the Right Direction? by Peter E. Rivard, Amy K. Rosen, and John S. Carroll. Take a professional position, from the HIM per ...

Business analytics and statistics research report -this

Business Analytics and Statistics Research Report - This assignment is based on fictional data. You are creating a business report for the CEO of a retail company called, Athlete Panda. It must be professional in present ...

Business statistics project assignment -there will be two

BUSINESS STATISTICS PROJECT ASSIGNMENT - There will be two parts to this assignment: Part A: Group Work (A Business Report) Part B: Individual Reflective Piece (A Ministerial Brief) The response to Part A must be provide ...

Go to the webliography source for the national cancer

Go to the Webliography source for the National Cancer Institute's Surveillance, Epidemiology, and End Results (SEER) Program. In the Fast Stats, create your own cancer statistical report, "Stratified by Data Type," and u ...

Part a -question 1 - true or false in data collection the

Part A - Question 1 - True or False: In data collection, the most common technique to ensure proper representation of the population is to use a random sample. True False Question 2 - Most analysts focus on the cost of H ...

Applied statistics homework project -download the data

Applied Statistics Homework Project - Download the data twoGenes.sav from the Week Four content area of brightspace. Each row represents data from a different sample of yeast RNA expression. The data represent the log2 f ...

Assignment - statistics in educational researchpart a -

Assignment - Statistics in Educational Research Part A - Show all your work Q1) A teacher asked each of her students how many novels they had read in the previous six months. The results are shown below. 0 1 5 4 2 1 3 2 ...

Assignment -in this assignment ms excel must be used to

Assignment - In this assignment MS Excel must be used to perform any calculations/graphical presentations as required in this assignment. Question 1 - Below you are given the examination scores of 20 students (data set a ...

  • 4,153,160 Questions Asked
  • 13,132 Experts
  • 2,558,936 Questions Answered

Ask Experts for help!!

Looking for Assignment Help?

Start excelling in your Courses, Get help with Assignment

Write us your full requirement for evaluation and you will receive response within 20 minutes turnaround time.

Ask Now Help with Problems, Get a Best Answer

Why might a bank avoid the use of interest rate swaps even

Why might a bank avoid the use of interest rate swaps, even when the institution is exposed to significant interest rate

Describe the difference between zero coupon bonds and

Describe the difference between zero coupon bonds and coupon bonds. Under what conditions will a coupon bond sell at a p

Compute the present value of an annuity of 880 per year

Compute the present value of an annuity of $ 880 per year for 16 years, given a discount rate of 6 percent per annum. As

Compute the present value of an 1150 payment made in ten

Compute the present value of an $1,150 payment made in ten years when the discount rate is 12 percent. (Do not round int

Compute the present value of an annuity of 699 per year

Compute the present value of an annuity of $ 699 per year for 19 years, given a discount rate of 6 percent per annum. As