Ask Question, Ask an Expert

+61-413 786 465

info@mywordsolution.com

Ask Statistics and Probability Expert

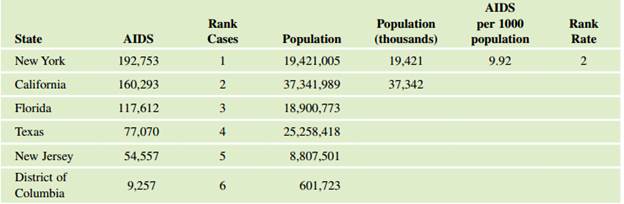
Living with AIDS The accompanying table gives the numbers of people diagnosed with AIDS/HIV in 2010 in the five states with the largest numbers of cases, as well as the District of Columbia, as reported by the U.S. Centers for Disease Control and Prevention (CDC).

It also shows the population of those regions at that time, from the U.S. Census Bureau.

QUESTION Find the number of people diagnosed with AIDS/ HIV per thousand in each region, and rank the six regions from highest rate (rank 1) to lowest rate (rank 6). Compare these rankings (of rates) with the ranks of total number of cases.

If you moved to one of these regions and met 50 random people, in which region would you be most likely to meet at least one person diagnosed with HIV? In which of these regions would you be least likely to meet at least one person diagnosed with AIDS?

Step 1 Figure out the populations of the remaining regions in thousands, and add them to the table. Step 2 For each region, divide the number of people living with AIDS by the population in thousands, and fill in column 6.

Step 3 Enter the ranks for the rates of AIDS patients per 1000 population, using 1 for the largest value and 6 for the smallest.

Step 4 Are the ranks for the rates the same as the ranks for the numbers of cases? If not, describe at least one difference.

Step 5 Finally, if you moved to one of these regions and met 50 random people, in which region would you be most likely to meet at least one person living with HIV? In which region would you be least likely to meet at least one person living with HIV?

335_rank.png

Statistics and Probability, Statistics

  • Category:- Statistics and Probability
  • Reference No.:- M92595487

Have any Question?


Related Questions in Statistics and Probability

Find a 95confidence interval for the population mean using

Find a 95%confidence interval for the population mean, using the formula or technology. Assuming that the population is normally distributed, construct a 95% confidence interval for the population mean, based on the foll ...

Hayley motorcycle company just paid a dividend of 14 today

Hayley Motorcycle Company just paid a dividend of $1.4 today, and is expected to pay a dividend in year 1 of $1.8, a dividend in year 2 of $2.3, a dividend in year 3 of $2.9, and a dividend in year 4 of $3.8. After year ...

Find the modified internal rate of return mirr for the

Find the modified internal rate of return (MIRR) for the following series of future cash flows if the company is able to reinvest cash flows received from the project at an annual rate of 8.24 percent. The initial outlay ...

Thirty-eight percent of consumers prefer to purchase

Thirty-eight percent of consumers prefer to purchase electronics online. You randomly select 16 consumers. Find the probability that the number who prefer to purchase electronics online is at most 5.

Since this in an empirical question that means that 68 is

Since this in an empirical question that means that 68% is in the middle and on the outer sides are the difference? The median life span of a mouse is 118 weeks Would you expect the life-span to be normally distributed? ...

Many high school students take the ap tests in different

Many high school students take the AP tests in different subject areas. In 2007, of the 144,796 students who took the biology exam 84,199 of them were female. In that same year, of the 211,693 students who took the calcu ...

Research research and sample 5000 household concerning tv

Research research and Sample 5000 household concerning TV shows they watch. Based on the sample 18% reported watching 60 Minutes. What is the 95% confidence interval for the proportion of all Americans that watch 60 minu ...

In a certain state pickup trucks account for 21 of the

In a certain? state, pickup trucks account for 21?% of the? state's registered vehicles. If 100 registered vehicles are selected at? random, what is the expected number of pickup? trucks?

On a correlation matrix you will usually see two values per

On a correlation matrix, you will usually see two values per comparison. The top value for a correlation measurement will be the Pearson correlation, right under that you will see a p-value. I understand when you have a ...

According to an article in the american heart associations

According to an article in the American Heart Association's publication Circulation, 24% of patients who had been hospitalized for an acute myocardial infarction, did not fill their cardiac medication by the seventh day ...

  • 4,153,160 Questions Asked
  • 13,132 Experts
  • 2,558,936 Questions Answered

Ask Experts for help!!

Looking for Assignment Help?

Start excelling in your Courses, Get help with Assignment

Write us your full requirement for evaluation and you will receive response within 20 minutes turnaround time.

Ask Now Help with Problems, Get a Best Answer

Why might a bank avoid the use of interest rate swaps even

Why might a bank avoid the use of interest rate swaps, even when the institution is exposed to significant interest rate

Describe the difference between zero coupon bonds and

Describe the difference between zero coupon bonds and coupon bonds. Under what conditions will a coupon bond sell at a p

Compute the present value of an annuity of 880 per year

Compute the present value of an annuity of $ 880 per year for 16 years, given a discount rate of 6 percent per annum. As

Compute the present value of an 1150 payment made in ten

Compute the present value of an $1,150 payment made in ten years when the discount rate is 12 percent. (Do not round int

Compute the present value of an annuity of 699 per year

Compute the present value of an annuity of $ 699 per year for 19 years, given a discount rate of 6 percent per annum. As