Lab for Statistics Assignments
Lab Assignment 1 -
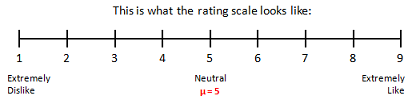
As a class, you will rate both Chips Ahoy and Milano cookies on a 1-9 scale. You want to find out if there is a significant difference between Chips Ahoy or Milano against an average cookie rating of μ = 5 with a σ = 1.5 (assume a normal distribution for this average cookie rating).
You will use SPSS to conduct your analysis. You will also hand draw distributions and make some calculations of your own using the data.
1. Create a graph on Excel to plot the mean ratings for Chips Ahoy and Milano, as well as the average cookie rating. Below the graph, describe the mean differences and what this difference might tell you about the two cookies.
2. Review the standard deviations for both the Chips Ahoy and the Milano ratings. For which cookie did the class agree the most about the rating? Provide the SD values to support your claim.
3. Use the "Chips Ahoy" ratings for the next few questions. Test to see if people rate Chips Ahoy (the treatment) significantly different from the average cookie. Assume that an average cookie has a rating of μ=5 with a σ = 1.5and is normally distributed.
a. What is the null hypothesis in notation?
b. What is the alternative hypothesis in notation?
c. On the SPSS printout, draw a DSM with a critical region area shaded using an alpha of .05.
d. What is the standard error for your Chips Ahoy sample as reported by SPSS (this is called the estimated standard error)? What is the realstandard error using the population standard deviation of 1.5 (calculate this by hand)?
e. Calculate the Chips Ahoy Mean's z-score using the real standard error. (Do not use SPSS' estimated standard error).
f. Make a statistical decision regarding this test using correct final notation and an alpha of .05. (Example of the notation is in Step 4 of the hypothesis test process.)
g. What does your statistical decision say about Chips Ahoy cookies compared to an average cookie?
4. Use the "Milano" ratings for the next few questions. Test to see if people rate Milano (the treatment) significantly different from the average cookie. Assume that an average cookie has a rating of μ=5 with a σ=1.5 and is normally distributed.
a. What is the null hypothesis in notation?
b. What is the alternative hypothesis in notation?
c. On the SPSS printout, draw a DSM with a critical region area shaded using an alpha of .05.
d. What is the standard error for your Milano sample as reported by SPSS (this is called the estimated standard error)? What is thereal standard error using the population standard deviation of 1.5 (calculate this by hand)?
e. Calculate the Milano Mean's z-score using the real standard error. (Do not use SPSS' estimated standard error).
f. Make a statistical decision regarding this test using correct final notation and an alpha of .05. (Example of the notation is in Step 4 of the hypothesis test process.)
g. What does your statistical decision say about Milano cookies compared to an average cookie?
Lab Assignment 2 -
McDonald's wants to sell more Big Macs with the "Monopoly Game" (which entices customers to buy more frequently for the chance at winning prizes). McDonald's tries this game on one store to see if applying the game to all stores will have a significant impact on sales.
Prior to the "Monopoly Game" promotion, McDonald's restaurants sale an average of μ = 50 Big Macs a day.
For the first 3 weeks during the "Monopoly Game," the restaurant kept track of the amount of Big Macs it sold each day.
1. Create a graph on Excel to plot the overall mean sales of Big Macs before the Monopoly game and the mean sales ofBig Macs during the Monopoly game. Below the graph, describe the difference between the sample mean and the μ. Does this graph alone prove that the Monopoly Game was significant?
2. Write the null hypothesis notation for a two-tailed test. Write this null hypothesis in a sentence.
3. Write the alternative hypothesis notation for a two-tailed test. Write this alternative hypothesis in a sentence.
4. Write the alternative hypothesis notation for a one-tailed test (assuming that McDonald's wants to increase sells). Write this alternative hypothesis in a sentence.
5. What is the sample's t-value and degrees of freedom for this study? (Note that SPSS calculates your t-value and df for you)
6. Use an alpha level of .01 for the two-tailed test.
a. Find this alpha's t value. Create a t distribution graph, shade the critical region, and locate the sample's t value.
b. Write the statistical notation for the final decision at this alpha level of .01.
c. Will the Monopoly Game affect Big Mac sales in all McDonald's restaurants?
7. Use an alpha level of .01 for the one-tailed test.
a. Find this alpha's t value. Create a t distribution graph, shade the critical region, and locate the sample's t value.
b. Write the statistical notation for the final decision at this alpha level of .01.
c. Will the Monopoly Game increase Big Mac sales in all McDonald's restaurants?
8. What effect size does this Monopoly Game have on Big Mac sales? (Calculate the estimated Cohen's d).
Attachment:- Assignment Files.rar