Ask Question, Ask an Expert

+61-413 786 465

info@mywordsolution.com

Ask Applied Statistics Expert

Introduction to Biostatistics Assignment -

Please answer all 7 questions. Some of the questions require you to analyse the unique assignment data set which I have created for you. This is labelled 'dataforxxxxxxxx.RData' where xxxxxxxx represents your Student ID number. You can find this with your Assessment materials in vUWS. Please also locate and read 'Description of your data set.docx'. Note: Each student will get different answers as the data sets differ.

Question 1 - A random sample of 10 former University of Eastern Sydney students was ask whether they drink more or less since they graduated from University. Their answers were:

more, less, less, less, more, less, less, less, less, more

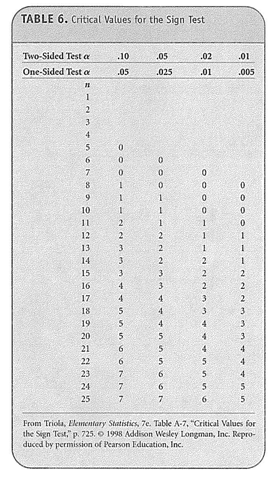
Conduct a sign test to see whether or not this provides evidence of a change in drinking habits of the wider population of graduates from University of Eastern Sydney. Use the 5-step method and show all working. Use the Table 6 from the textbook (below) to determine the decision rule or use R Commander to calculate the p-value.
700_figure.png

Question 2 - Research question: What is the mean well-being (WEMWBS) score for University of Eastern Sydney Students?

Using the University of Eastern Sydney data set assigned to you and R Commander:

a. Calculate the 95% confidence interval for the mean well-being (WEMWBS) score in this population.

b. Write a sentence which answers the research question above as fully as possible.

This research question applies to questions 3 and 4

Research question: Among University of Eastern Sydney students, do self-reporting drug users (variable: drug) have lower well-being scores (variable: WEMWBS) than non-users?

Question 3 - Would you address this research question with a one-tailed hypothesis test or a two-tailed hypothesis test? Explain why.

Write the null and alternate hypotheses for a parametric hypothesis test, fully defining any symbols which you use.

Using the University of Eastern Sydney data set assigned to you and R Commander find and report

i. the mean wellbeing (WEMWBS) score for drug users in the sample

ii. the mean wellbeing (WEMWBS) score for non-users in the sample

iii. the p-value for the difference in mean wellbeing (WEMWBS) between these two groups in the population

Based on the results of c) provide your answer to the research question.

Question 4 - Conduct an equivalent nonparametric hypothesis test for this research question. Please use R Commander for all calculations, but follow the 5 step method in your presentation.

Question 5 - Suppose that the WEMWBS wellbeing score had been designed to be Normally distributed with a mean μ = 44 and standard deviation σ = 4. Suppose we wished to undertake a study to test whether the mean wellbeing (WEMWBS) score of Western Sydney University students was at least half a standard deviation better than average. Suppose we wished the test to return 90% power of detecting a difference of this size at the α = 0.05 significance level. Use an appropriate online calculator to calculate the minimum required sample size for this study. Present your answer as a sentence which details the required sample size to achieve what power subject to what conditions.

Question 6 - Research question: Does the proportion of students self-reporting as illicit drugs users differ by gender in the University of Eastern Sydney population?

Using the University of Eastern Sydney data set assigned to you and R Commander:

a. Show the relationship between illicit drug use and gender using a two-way contingency table. Include either row or column percentages. Type and label the table yourself; an R Commander screenshot will not be accepted.

b. Are the requirements for a Chi-square test met? Explain why.

c. Irrespective of your answer in part b. address the research question using a Chi-square test. Ensure you specify the hypotheses you are testing and explain the evidence for or against the hypothesis.

Question 7 - Estimate the minimum sample size required to produce a 95% confidence interval with a margin of error of ±4% for the proportion of illicit drug users among Western Sydney University students. Present your answer as a sentence which summarises the required sample size to achieve what confidence level subject to what conditions.

Attachment:- Assignment Files.rar

Applied Statistics, Statistics

  • Category:- Applied Statistics
  • Reference No.:- M92792532

Have any Question?


Related Questions in Applied Statistics

Quantitative methods in health statistical analysis report

Quantitative Methods in Health Statistical Analysis Report - Question 1 - Are you a Lark or an Owl? Studies indicate that about 10% of us are morning people (Larks) while 20% are evening people (Owls) and the rest are no ...

Exercise -q1 do the example data in table 35-2 meet the

Exercise - Q1. Do the example data in Table 35-2 meet the assumptions for the Pearson χ 2 test? Provide a rationale for your answer. Q2. Compute the χ 2 test. What is the χ 2 value? Q3. Is the χ 2 significant at α = 0.05 ...

Business analytics and statistics research report -this

Business Analytics and Statistics Research Report - This assignment is based on fictional data. You are creating a business report for the CEO of a retail company called, Athlete Panda. It must be professional in present ...

Part a -question 1 - true or false in data collection the

Part A - Question 1 - True or False: In data collection, the most common technique to ensure proper representation of the population is to use a random sample. True False Question 2 - Most analysts focus on the cost of H ...

Business analytics and statistics research report -this

Business Analytics and Statistics Research Report - This assignment is based on fictional data. You are creating a business report for the CEO of a retail company called, Athlete Panda. It must be professional in present ...

Business data analysis facts from figures assignment

BUSINESS DATA ANALYSIS: FACTS FROM FIGURES Assignment - Question 1 - Private capital expenditure for 12 successive quarters are presented in the following table: Quarter Millions     1 31,920 2 25,120 3 30,350 4 24,650 5 ...

You are expected to work in groups and write a research

You are expected to work in groups and write a research report. When you work on your report, you need to use the dataset, and other sources such as journal articles. If you use website material, please pay attention to ...

Go to the institute for healthcare improvement ihi website

Go to the Institute for Healthcare Improvement (IHI) website for their Improvement Map (URL located in the Webliography). Select an improvement process of your choice. Present at least 3 quality paragraphs to the class a ...

Business data analysis computer assignment -part 1

Business Data Analysis Computer Assignment - PART 1 - Economists believe that high rates of unemployment are linked to decreased life satisfaction ratings. To investigate this relationship, a researcher plans to survey a ...

A company produces labeled packaging material and the

A company produces labeled packaging material and the company intends to buy a new machine for shaping and labeling. The company has been approached by two different companies and the production manager did a test on the ...

  • 4,153,160 Questions Asked
  • 13,132 Experts
  • 2,558,936 Questions Answered

Ask Experts for help!!

Looking for Assignment Help?

Start excelling in your Courses, Get help with Assignment

Write us your full requirement for evaluation and you will receive response within 20 minutes turnaround time.

Ask Now Help with Problems, Get a Best Answer

Why might a bank avoid the use of interest rate swaps even

Why might a bank avoid the use of interest rate swaps, even when the institution is exposed to significant interest rate

Describe the difference between zero coupon bonds and

Describe the difference between zero coupon bonds and coupon bonds. Under what conditions will a coupon bond sell at a p

Compute the present value of an annuity of 880 per year

Compute the present value of an annuity of $ 880 per year for 16 years, given a discount rate of 6 percent per annum. As

Compute the present value of an 1150 payment made in ten

Compute the present value of an $1,150 payment made in ten years when the discount rate is 12 percent. (Do not round int

Compute the present value of an annuity of 699 per year

Compute the present value of an annuity of $ 699 per year for 19 years, given a discount rate of 6 percent per annum. As