Ask Question, Ask an Expert

+61-413 786 465

info@mywordsolution.com

Ask Statistics and Probability Expert

Interpreting Statistics Worksheet

Testing of 20 randomly selected subjects yielded two sets of scores: Verbal IQ and Reading Comprehension.

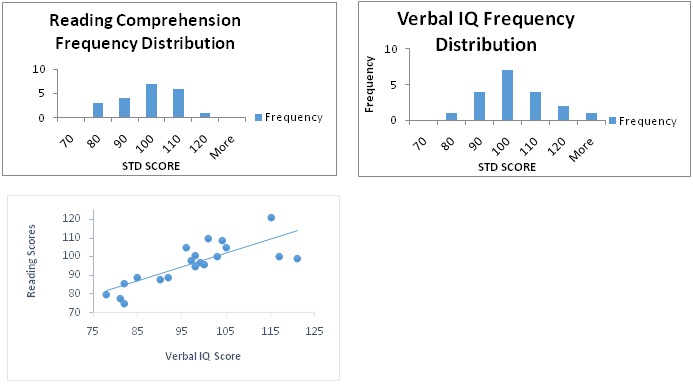
The table below displays the results and descriptive statistics, as well as frequency distribution charts for each variable and a scatterplot of the correlations between the two variables:

Subject Verbal IQ Rdg.Comp.
1 90 88
2 99 97
3 101 110
4 115 121
5 97 98
6 98 95
7 92 89
8 104 109
9 103 100
10 117 100
11 100 96
12 98 101
13 96 105
14 105 105
15 78 80
16 121 99
17 82 75
18 85 89
19 81 78
20 82 86
MEAN 97 96
MEDIAN 98 97
MODE 98 89
STD.DEV. 11.8 11.2
RANGE 43 46
CORREL VERB x RDG 0.79

1544_graph.jpg

Please answer the following questions within the appropriate column in the table below:

I. Using the provided data and graphs, describe thefrequency distributionfor the IQ test:

a) What is a typical score for this sample?

b) How variable are the scores?

c) How are the scores distributed?

II. Using the provided data and graphs, describe thefrequency distribution of the reading test scores:

a) What is a typical score for this sample?

b) How variable are the scores?

c) How are the scores distributed?

III. Consider the correlation datagiven the provided data and graph:

a) How are IQ and reading achievement related?

IV.Evaluate the data from a psychological testing perspective:

a) Are these samples good representations of the general population?How do you know?

b) What could you do to make them a more representative sample?

c) How would you interpret the correlation results?

d) What are some ways this knowledge of their relationship could be used?

Statistics and Probability, Statistics

  • Category:- Statistics and Probability
  • Reference No.:- M92651703
  • Price:- $30

Priced at Now at $30, Verified Solution

Have any Question?


Related Questions in Statistics and Probability

A nutritional scientist wishes to study the effect of

A nutritional scientist wishes to study the effect of storage time on the amount of vitamin C (milligrams) contained in 50 gram freeze dried fruit packs when stored for one, one and a half and 2 years. Five fruit packs w ...

If all the data values in a population are converted to

If all the data values in a population are converted to? z-scores, the distribution of? z-scores will have what? mean? Choose the correct answer below. A. The mean of the? z-scores will be zero. B. The mean of the? z-sco ...

A test of the null A test of the null hypothesis  H 0 :  μ  =  μ 0  gives test statistic 

A test of the null hypothesis  H 0 :  μ  =  μ 0  gives test statistic  z  = -0.58  (Round your answers to four decimal places.) a) What is the  P -value if the alternative is  H a :  μ  >  μ 0 ? b) What is the  P -value ...

On a correlation matrix you will usually see two values per

On a correlation matrix, you will usually see two values per comparison. The top value for a correlation measurement will be the Pearson correlation, right under that you will see a p-value. I understand when you have a ...

How do you calculate conditional probability for behaviors

How do you calculate conditional probability for behaviors in applied behavior analysis?

A financial planning licensee striving for excellence in

"A Financial Planning Licensee striving for excellence in their fiduciary duty has decided to set a maximum limit of gearing for all client financial plans they construct." Comment on the merit of taking such an approach ...

A confidence interval for a population mean is to be

A confidence interval for a population mean is to be estimated. The population standard deviation is guessed to be anywhere from 14 to 24. The half-width B desired could be anywhere from 2 to 7. Tabulate the minimum samp ...

Consider a hypothesis testing problem where the null and

Consider a hypothesis testing problem where the null and the alternative hypotheses are defined as H0 μ=5 Vs. H1 :μ≠5 H0:μ=5 Vs. H1:μ≠5 A 95% confidence interval for μ was calculated as (2, 7). A) What would be your conc ...

Want the 98 confidence interval when the sample size is 50

Want the 98% confidence interval when the sample size is 50, sample mean is 42 and sample standard deviation is 5. Keep three decimal places in your response.

Suppose a firm uses sales teams to market their products

Suppose a firm uses sales teams to market their products. For example, a construction equipment manufacturer may assign three sales agents to a team so each team member can specialize in particular product functions (e.g ...

  • 4,153,160 Questions Asked
  • 13,132 Experts
  • 2,558,936 Questions Answered

Ask Experts for help!!

Looking for Assignment Help?

Start excelling in your Courses, Get help with Assignment

Write us your full requirement for evaluation and you will receive response within 20 minutes turnaround time.

Ask Now Help with Problems, Get a Best Answer

Why might a bank avoid the use of interest rate swaps even

Why might a bank avoid the use of interest rate swaps, even when the institution is exposed to significant interest rate

Describe the difference between zero coupon bonds and

Describe the difference between zero coupon bonds and coupon bonds. Under what conditions will a coupon bond sell at a p

Compute the present value of an annuity of 880 per year

Compute the present value of an annuity of $ 880 per year for 16 years, given a discount rate of 6 percent per annum. As

Compute the present value of an 1150 payment made in ten

Compute the present value of an $1,150 payment made in ten years when the discount rate is 12 percent. (Do not round int

Compute the present value of an annuity of 699 per year

Compute the present value of an annuity of $ 699 per year for 19 years, given a discount rate of 6 percent per annum. As