Ask Applied Statistics Expert

Interpreting Statistics Worksheet

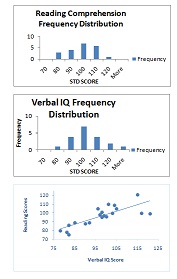
Testing of 20 randomly selected subjects yielded two sets of scores: Verbal IQ and Reading Comprehension. The table below displays the results and descriptive statistics, as well as frequency distribution charts for each variable and a scatterplot of the correlations between the two variables:

Subject

Verbal IQ

Rdg.Comp.

1

90

88

2

99

97

3

101

110

4

115

121

5

97

98

6

98

95

7

92

89

8

104

109

9

103

100

10

117

100

11

100

96

12

98

101

13

96

105

14

105

105

15

78

80

16

121

99

17

82

75

18

85

89

19

81

78

20

82

86

MEAN

97

96

MEDIAN

98

97

MODE

98

89

STD.DEV.

11.8

11.2

RANGE

43

46

CORREL VERB x RDG

0.79


2137_111111111.jpg


Please answer the following questions within the appropriate column in the table below:

I. Using the provided data and graphs, describe thefrequency distributionfor the IQ test:

a) What is a typical score for this sample?

b) How variable are the scores?

c) How are the scores distributed?

II. Using the provided data and graphs, describe thefrequency distribution of the reading test scores:

a) What is a typical score for this sample?

b) How variable are the scores?

c) How are the scores distributed?

III. Consider the correlation datagiven the provided data and graph:

a) How are IQ and reading achievement related?

IV.Evaluate the data from a psychological testing perspective:

a) Are these samples good representations of the general population?How do you know?

b) What could you do to make them a more representative sample?

c) How would you interpret the correlation results?

d) What are some ways this knowledge of their relationship could be used?

Applied Statistics, Statistics

  • Category:- Applied Statistics
  • Reference No.:- M92183138
  • Price:- $20

Priced at Now at $20, Verified Solution

Have any Question?


Related Questions in Applied Statistics

Question onea a factory manager claims that workers at

QUESTION ONE (a) A factory manager claims that workers at plant A are faster than those at plant B. To test the claim, a random sample of times (in minutes) taken to complete a given task was taken from each of the plant ...

You are expected to work in groups and write a research

You are expected to work in groups and write a research report. When you work on your report, you need to use the dataset, and other sources such as journal articles. If you use website material, please pay attention to ...

Assignment -for each of the prompts below report the

Assignment - For each of the prompts below, report the appropriate degrees of freedom, t statistic, p-value and plot using the statistical software platform of your choice (R/STATA) 1) A sample of 12 men and 14 women hav ...

Assignment - research topicpurpose the purpose of this task

Assignment - Research topic Purpose: The purpose of this task is to ensure you are progressing satisfactorily with your research project, and that you have clean, useable data to analyse for your final project report. Ta ...

Assessment task -you become interested in the non-skeletal

Assessment Task - You become interested in the non-skeletal effects of vitamin D and review the literature. On the basis of your reading you find that there is some evidence to suggest that vitamin D deficiency is linked ...

Part a -question 1 - an analyst considers to test the order

PART A - Question 1 - An analyst considers to test the order of integration of some time series data. She decides to use the DF test. She estimates a regression of the form Δy t = μ + ψy t-1 + u t and obtains the estimat ...

Medical and applied physiology experimental report

Medical and Applied Physiology Experimental Report Assignment - Title - Compare the working and spatial memory by EEG. 30 students were tested (2 memory games were played to test their memory - a card game and a number g ...

Business data analysis computer assignment -part 1

Business Data Analysis Computer Assignment - PART 1 - Economists believe that high rates of unemployment are linked to decreased life satisfaction ratings. To investigate this relationship, a researcher plans to survey a ...

Question - go to the website national quality forum nqf

Question - Go to the website, National Quality Forum (NQF), located in the Webliography, and download the article by WIRED FOR QUALITY: The Intersection of Health IT and Healthcare Quality, Number 8, MARCH 2008. You are ...

Go to the webliography source for the national cancer

Go to the Webliography source for the National Cancer Institute's Surveillance, Epidemiology, and End Results (SEER) Program. In the Fast Stats, create your own cancer statistical report, "Stratified by Data Type," and u ...

  • 4,153,160 Questions Asked
  • 13,132 Experts
  • 2,558,936 Questions Answered

Ask Experts for help!!

Looking for Assignment Help?

Start excelling in your Courses, Get help with Assignment

Write us your full requirement for evaluation and you will receive response within 20 minutes turnaround time.

Ask Now Help with Problems, Get a Best Answer

Why might a bank avoid the use of interest rate swaps even

Why might a bank avoid the use of interest rate swaps, even when the institution is exposed to significant interest rate

Describe the difference between zero coupon bonds and

Describe the difference between zero coupon bonds and coupon bonds. Under what conditions will a coupon bond sell at a p

Compute the present value of an annuity of 880 per year

Compute the present value of an annuity of $ 880 per year for 16 years, given a discount rate of 6 percent per annum. As

Compute the present value of an 1150 payment made in ten

Compute the present value of an $1,150 payment made in ten years when the discount rate is 12 percent. (Do not round int

Compute the present value of an annuity of 699 per year

Compute the present value of an annuity of $ 699 per year for 19 years, given a discount rate of 6 percent per annum. As