Ask Question, Ask an Expert

+61-413 786 465

info@mywordsolution.com

Ask Applied Statistics Expert

Instructions:

• This Assignment must be submitted on Blackboard via the allocated folder.

• Email submission will not be accepted.

• You are advised to make your work clear and well-presented, marks may be reduced for poor presentation.

• You MUST show all your work.

• Late submission will result in ZERO marks being awarded.

• Identical copy from students or other resources will result in ZERO marks for all involved students.

• This is an individual assignment.

Question One

Assume you have completed three months of the project FG. The Budget at Completion (BAC) was 200,000 for this six-month project. Also assume the following:

• Planned Value (PV) = $ 120,000

• Earned Value (EV) = $ 60,000

• Actual Cost (AC) = $ 90,000

1. Calculate the following:

Cost Variance (CV) =?

Schedule Variance (SV) =?

Cost Performance Index (CPI) =?

Schedule Performance Index (SPI) =?

Estimated time to complete =?

2. Explain the meaning of the obtained results for all CV, SV, CPI, and SPI formulas in the above questions?

(Hint: CPI value is =1, means the cost of the project is on budget)

Question Two

Consider the following Network Diagram:
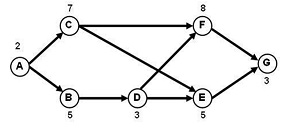
1175_Q2.jpg

Calculate the ES,EF,LS,LF and Slack time for each node:

Activity

Precedent

Duration

ES

EF

LS

LF

Slack

A

-

 2


B

A

5


C

A

7


D

B

3


E

C, D

5


F

C, D

8


G

F, E

3


Applied Statistics, Statistics

  • Category:- Applied Statistics
  • Reference No.:- M92549274

Have any Question?


Related Questions in Applied Statistics

Quantitative methods in health statistical analysis report

Quantitative Methods in Health Statistical Analysis Report - Question 1 - Are you a Lark or an Owl? Studies indicate that about 10% of us are morning people (Larks) while 20% are evening people (Owls) and the rest are no ...

Business analytics and statistics research reportthis

Business Analytics and Statistics Research Report This assignment is based on fictional data. You are creating a business report for the CEO of a retail company called, Athlete Panda. It must be professional in presentat ...

What are the uses of the chi-square test in terms of data

What are the uses of the chi-square test in terms of data analysis for quality, safety, and patient safety? Provide two specific examples of when a HIM professional would use chi-square and why.

Question - go to the website national quality forum nqf

Question - Go to the website, National Quality Forum (NQF), located in the Webliography, and download the article by WIRED FOR QUALITY: The Intersection of Health IT and Healthcare Quality, Number 8, MARCH 2008. You are ...

Using minitab statistics to calculate the various

Using Minitab Statistics to calculate the various T-Tests The steps required for completing the deliverables for this assignment (screen shots that correspond to these instructions can be found immediately following them ...

Applied statistics - regression assignmentin this

Applied Statistics - Regression Assignment In this assignment you are expected to set up a regression equation, run that regression and interpret and evaluate the results. You will need to carefully state all null hypoth ...

Assignment - statistics in educational researchpart a -

Assignment - Statistics in Educational Research Part A - Show all your work Q1) A teacher asked each of her students how many novels they had read in the previous six months. The results are shown below. 0 1 5 4 2 1 3 2 ...

Go to the institute for healthcare improvement ihi website

Go to the Institute for Healthcare Improvement (IHI) website for their Improvement Map (URL located in the Webliography). Select an improvement process of your choice. Present at least 3 quality paragraphs to the class a ...

Statistics for business decisions assignment assignment 1

Statistics for Business Decisions Assignment Assignment 1 - QUESTION 1 - Time Series Regression The table below presents the number of students attending Statistics lectures in weeks 1 to 10. Week Number of students 1 90 ...

Go to the webliography source for the national cancer

Go to the Webliography source for the National Cancer Institute's Surveillance, Epidemiology, and End Results (SEER) Program. In the Fast Stats, create your own cancer statistical report, "Stratified by Data Type," and u ...

  • 4,153,160 Questions Asked
  • 13,132 Experts
  • 2,558,936 Questions Answered

Ask Experts for help!!

Looking for Assignment Help?

Start excelling in your Courses, Get help with Assignment

Write us your full requirement for evaluation and you will receive response within 20 minutes turnaround time.

Ask Now Help with Problems, Get a Best Answer

Why might a bank avoid the use of interest rate swaps even

Why might a bank avoid the use of interest rate swaps, even when the institution is exposed to significant interest rate

Describe the difference between zero coupon bonds and

Describe the difference between zero coupon bonds and coupon bonds. Under what conditions will a coupon bond sell at a p

Compute the present value of an annuity of 880 per year

Compute the present value of an annuity of $ 880 per year for 16 years, given a discount rate of 6 percent per annum. As

Compute the present value of an 1150 payment made in ten

Compute the present value of an $1,150 payment made in ten years when the discount rate is 12 percent. (Do not round int

Compute the present value of an annuity of 699 per year

Compute the present value of an annuity of $ 699 per year for 19 years, given a discount rate of 6 percent per annum. As