Ask Question, Ask an Expert

+61-413 786 465

info@mywordsolution.com

Ask Statistics and Probability Expert

Income and housing revisited. In given Exercise, we learned that the Office of Federal Housing Enterprise Oversight (OFHEO) collects data on various aspects of housing costs around the United States. Here's a scatterplot (by state) of the Housing Cost Index (HCI) versus the Median Family Income (MFI) for the 50 states. The correlation is r = 0.65. The mean HCI is 338.2, with a standard deviation of 116.55. The mean MFI is $46,234, with a standard deviation of $7072.47.

1053_Graph 04.jpg

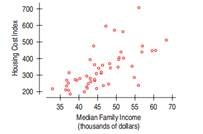
a) Is a regression analysis appropriate? Explain.

b) What is the equation that predicts Housing Cost Index from median family income?

c) For a state with what would be the predicted HCI?

d) Washington, DC, has an MFI of $44,993 and an HCI of 548.02. How far off is the prediction in b) from the actual HCI?

e) If we standardized both variables, what would be the regression equation that predicts standardized HCI from standardized MFI?

f) If we standardized both variables, what would be the regression equation that predicts standardized MFI from standardized HCI?

Exercise :
Income and housing. The Office of Federal Housing Enterprise Oversight (www.ofheo.gov) collects data on various aspects of housing costs around the United States. Here is a scatterplot of the Housing Cost Index versus the Median Family Income for each of the 50 states. The correlation is 0.65.

123_Graph 05.jpg

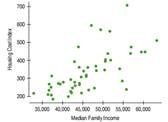
a) Describe the relationship between the Housing Cost Index and the Median Family Income by state.

b) If we standardized both variables, what would the correlation coefficient between the standardized variables be?

c) If we had measured Median Family Income in thousands of dollars instead of dollars, how would the correlation change?

d) Washington, DC, has a Housing Cost Index of 548 and a median income of about $45,000. If we were to include DC in the data set, how would that affect the correlation coefficient?

e) Do these data provide proof that by raising the median income in a state, the Housing Cost Index will rise as a result? Explain.

Statistics and Probability, Statistics

  • Category:- Statistics and Probability
  • Reference No.:- M92211101

Have any Question?


Related Questions in Statistics and Probability

A fair die is rolled 36 times what is the standard

A fair die is rolled 36 times. What is the standard deviation of the even number (2, 4, or 6) outcomes?

Consider the average home mortgage in new zealand of 283

'"Consider the average home mortgage in New Zealand of $283 000 where the standard deviation of the mortgages is $50 000 and home mortgages are normally distributed. If a home is known to be more than $250 000, what is t ...

What is the difference between a linear quadratic and cubic

What is the difference between a linear, quadratic, and cubic regression analysis? Please provide a reference.

Suppose that x1 middot middot middot xn are normal with

Suppose that X1, · · · .Xn are normal with mean µ1; Y1, · · · , Yn are normal with mean µ2, and W1, · · · , Wn are normal with mean µ1 + µ2. Assuming that all 3n random variables are independent with a common variance, f ...

A particular manufacturing process is known to produce 03

A particular manufacturing process is known to produce 0.3 proportion defective items. Suppose that a sample of 10 items produced by this process are selected at random. (a) The probability that the sample will contain e ...

To finance additional inventory arbutus ltd is considering

To finance additional inventory, Arbutus Ltd. is considering forgoing the cash discount on all of its purchases presently offered on terms of 2/10, net 45. No payments will be stretched. Annual purchases are $9.21 millio ...

Suppose x is a normal random variable with mean mu 54 and

Suppose X is a normal random variable with mean μ = 54 and standard deviation σ =8.? Compute P(X > 42). (Round to four decimal places.)

The average height of young adult males has a normal

The average height of young adult males has a normal distribution with standard deviation of 2.5 inches. You want to estimate the mean height of students at your college or university to within 0.6 inch with 93% confiden ...

While preparing for their comeback tour the flaming rogers

While preparing for their comeback tour, the flaming Roger's find that the average time it takes their sound tech to set up for a show is 61 minutes, with a standard deviation of 4.1 minutes. If the band manager decides ...

Letnbspxbar6nbspdenote the sample mean of a

Let  X(bar) 6  denote the sample mean of a sample  X 1 ,  X 2 , ...,  X 6  from  Unif  (-1, 3). (a) What is the expected value of  X(bar) 6 ? (b) What is the variance of  X(bar) 6 ?

  • 4,153,160 Questions Asked
  • 13,132 Experts
  • 2,558,936 Questions Answered

Ask Experts for help!!

Looking for Assignment Help?

Start excelling in your Courses, Get help with Assignment

Write us your full requirement for evaluation and you will receive response within 20 minutes turnaround time.

Ask Now Help with Problems, Get a Best Answer

Why might a bank avoid the use of interest rate swaps even

Why might a bank avoid the use of interest rate swaps, even when the institution is exposed to significant interest rate

Describe the difference between zero coupon bonds and

Describe the difference between zero coupon bonds and coupon bonds. Under what conditions will a coupon bond sell at a p

Compute the present value of an annuity of 880 per year

Compute the present value of an annuity of $ 880 per year for 16 years, given a discount rate of 6 percent per annum. As

Compute the present value of an 1150 payment made in ten

Compute the present value of an $1,150 payment made in ten years when the discount rate is 12 percent. (Do not round int

Compute the present value of an annuity of 699 per year

Compute the present value of an annuity of $ 699 per year for 19 years, given a discount rate of 6 percent per annum. As