Ask Applied Statistics Expert

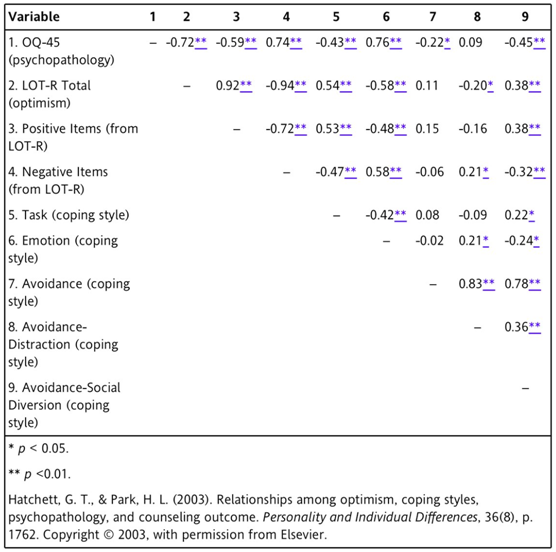
In Table 2 in p. 175, Hatchett and Park (2004) presented the correlations among optimism (LOT-R Total and Positive Items); pessimism (Negative Items); psychopathology (OQ-45); and coping styles (Task, Emotion, Avoidance, Avoidance-Distraction, and Avoidance-Social Diversion). Table 2 is a mirror-image table with the variables numbered and labeled on the y-axis and the numbers of the variables on the x-axis. The blank spaces in the table are where the variable is correlated with itself and would be a +1.00 correlation.

1. What is the r value listed for the relationship between variables 4 and 9?

2. Describe the correlation r = -0.32** using words. Is this a statistically significant correlation? Provide a rationale for your answer.

3. Calculate the percentage of variance explained for r = 0.53. Is this correlation clinically important? Provide a rationale for your answer.

4. According to Table 2, r = 0.15 is listed as the correlation between which two items? Describe this relationship. What is the effect size for this relationship, and what size sample would be needed to detect this relationship in future studies?

5. Calculate the percentage of variance explained for r = 0.15. Describe the clinical importance of this relationship.

6. Which two variables in Table 2, have the weakest correlation, or r value? Which relationship is the closest to this r value? Provide a rationale for your answer.

7. Is the correlation between LOT-R Total scores and Avoidance-Distraction coping style statistically significant? Is this relationship relevant to practice? Provide rationales for your answers.

8. Is the correlation between variables 9 and 4 significant? Is this correlation relevant to practice? Provide a rationale for your answer.

9. Consider two values, r = 0.08 and r = -0.58. Describe them in relationship to each other. Describe the clinical importance of both r values.

10. Examine the Pearson r values for LOT-R Total, which measured Optimism with the Task and Emotion Coping Styles. What do these results indicate? How might you use this information in your practice?

BONUS QUESTION

One of the study goals was to examine the relationship between optimism and psychopathology. Using the data in Table 2, formulate an opinion regarding the overall correlation between optimism and psychopathology. Provide a rationale for your answer.

985_Examine the relationship between optimism and psychopathology.png

Applied Statistics, Statistics

  • Category:- Applied Statistics
  • Reference No.:- M9749375

Have any Question?


Related Questions in Applied Statistics

Question onea a factory manager claims that workers at

QUESTION ONE (a) A factory manager claims that workers at plant A are faster than those at plant B. To test the claim, a random sample of times (in minutes) taken to complete a given task was taken from each of the plant ...

You are expected to work in groups and write a research

You are expected to work in groups and write a research report. When you work on your report, you need to use the dataset, and other sources such as journal articles. If you use website material, please pay attention to ...

Assignment -for each of the prompts below report the

Assignment - For each of the prompts below, report the appropriate degrees of freedom, t statistic, p-value and plot using the statistical software platform of your choice (R/STATA) 1) A sample of 12 men and 14 women hav ...

Assignment - research topicpurpose the purpose of this task

Assignment - Research topic Purpose: The purpose of this task is to ensure you are progressing satisfactorily with your research project, and that you have clean, useable data to analyse for your final project report. Ta ...

Assessment task -you become interested in the non-skeletal

Assessment Task - You become interested in the non-skeletal effects of vitamin D and review the literature. On the basis of your reading you find that there is some evidence to suggest that vitamin D deficiency is linked ...

Part a -question 1 - an analyst considers to test the order

PART A - Question 1 - An analyst considers to test the order of integration of some time series data. She decides to use the DF test. She estimates a regression of the form Δy t = μ + ψy t-1 + u t and obtains the estimat ...

Medical and applied physiology experimental report

Medical and Applied Physiology Experimental Report Assignment - Title - Compare the working and spatial memory by EEG. 30 students were tested (2 memory games were played to test their memory - a card game and a number g ...

Business data analysis computer assignment -part 1

Business Data Analysis Computer Assignment - PART 1 - Economists believe that high rates of unemployment are linked to decreased life satisfaction ratings. To investigate this relationship, a researcher plans to survey a ...

Question - go to the website national quality forum nqf

Question - Go to the website, National Quality Forum (NQF), located in the Webliography, and download the article by WIRED FOR QUALITY: The Intersection of Health IT and Healthcare Quality, Number 8, MARCH 2008. You are ...

Go to the webliography source for the national cancer

Go to the Webliography source for the National Cancer Institute's Surveillance, Epidemiology, and End Results (SEER) Program. In the Fast Stats, create your own cancer statistical report, "Stratified by Data Type," and u ...

  • 4,153,160 Questions Asked
  • 13,132 Experts
  • 2,558,936 Questions Answered

Ask Experts for help!!

Looking for Assignment Help?

Start excelling in your Courses, Get help with Assignment

Write us your full requirement for evaluation and you will receive response within 20 minutes turnaround time.

Ask Now Help with Problems, Get a Best Answer

Why might a bank avoid the use of interest rate swaps even

Why might a bank avoid the use of interest rate swaps, even when the institution is exposed to significant interest rate

Describe the difference between zero coupon bonds and

Describe the difference between zero coupon bonds and coupon bonds. Under what conditions will a coupon bond sell at a p

Compute the present value of an annuity of 880 per year

Compute the present value of an annuity of $ 880 per year for 16 years, given a discount rate of 6 percent per annum. As

Compute the present value of an 1150 payment made in ten

Compute the present value of an $1,150 payment made in ten years when the discount rate is 12 percent. (Do not round int

Compute the present value of an annuity of 699 per year

Compute the present value of an annuity of $ 699 per year for 19 years, given a discount rate of 6 percent per annum. As