Ask Question, Ask an Expert

+61-413 786 465

info@mywordsolution.com

Ask Applied Statistics Expert

1. In an article, a random sample of 42 felons convicted of “impulsive murder” was compared to a random sample of 40 felons convicted of premeditated murder. Both samples of felons were released from prison before completing the original sentence.  For the sample of 42 convicted of “impulsive murder,” 13 recorded parole violations. For the sample of 40 convicted of premeditated murder, 22 recorded parole violations.

Can the statistician infer at the 1% significance level that the proportion of parole violations is greater for the felons convicted of premeditated murder?

H0:
H1:
Test statistic:
Rejection region:
find outd test statistic:
Conclusion:

Estimate with 99% confidence the difference in population proportions.

2. In an important study centered on teenage smoking, a sample of 70 high school students in Edmonton claimed they smoked an average of 24.64 cigarettes per day, with a standard deviation of 9.23 cigarettes. A different sample of 70 high school students in Ontario claimed that, on average, they smoked 22.84 cigarettes daily, with a standard deviation of 8.75. At the 5% level of significance, test the hypothesis that the average number of cigarettes smoked per day is the same in both places.

H0:
H1:
Test statistic:
Rejection region:
find outd test statistic:

3. Briefly describe how you would diagnose each of the following conditions/problems related to regression analysis.

a) The potential for multicollinearity.
b) The probability distribution of the error variable is normal.
c) The mean of the distribution of the error variable is zero.
d) The standard deviation of the error variable is constant (i.e., homoscedastic)

4. With regard to an indicator such as infant deaths per 1,000 births, it is a pretty safe assumption that, as a whole, the developed nations in Europe, USA, and Japan statistically differ from the less developed countries in South America, the Middle East, and Asia. The problem is, do infant deaths per 1,000 in the less-developed countries in Latin America, the Middle East, and Africa differ?  The data below are reported by country in each region.

2221_infants death table.jpg

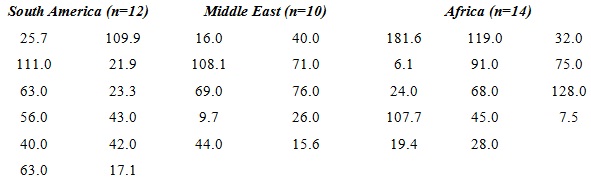
Conduct an analysis of variance for this data at the 5% level of significance.  For this problem, SST = 2547.30 and SSE = 56966.04.

H0:
H1:
Test statistic:
Rejection region:
find outd test statistic:
Conclusion:

5. An English teacher investigated some of the factors that affect an individual student’s final grade in his course. She proposed the multiple regression models:
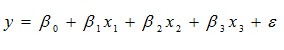
124_regression model.jpg

Where,

y = final mark (out of 100)
x1 =  number of lectures skipped
x2 =  number of late assignments
x3 =  mid-term test mark (out of 100)

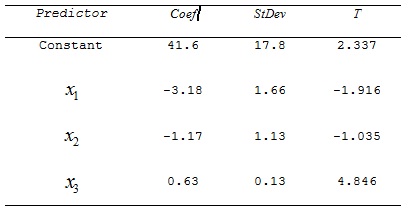
The teacher recorded the data for 50 randomly selected students. The computer output is shown below.

THE REGRESSION EQUATION IS:

y = 41.6 – 3.18 x1 – 1.17 x2 + .63 x3

593_regression equation.jpg

 ANALYSIS OF VARIANCE:

710_analysis of variance.jpg

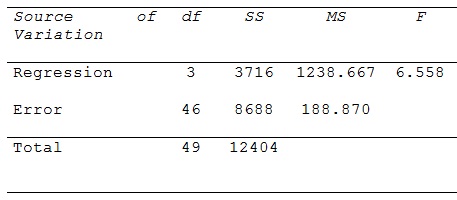
a) Do these data provide enough evidence to conclude at the 5% significance level that the model is useful in predicting the final mark? describe.

b) Do these data provide enough evidence to conclude at the 5% significance level that the final mark and the number of skipped lectures are linearly related?  describe.

c) Do these data provide enough evidence at the 1% significance level to conclude that the final mark and the mid-term mark are linearly related?  describe.

d) What is the coefficient of determination?  What does this statistic tell you?

e) Interpret the coefficients b1 and b3.  Be specific.

Applied Statistics, Statistics

  • Category:- Applied Statistics
  • Reference No.:- M941

Have any Question?


Related Questions in Applied Statistics

As the him member of your research team you are preparing

As the HIM member of your research team, you are preparing for a clinical trial study involving human subjects. The research would track two possible mutually exclusive outcomes, such as survive/did not survive, yes/no, ...

Question onea a factory manager claims that workers at

QUESTION ONE (a) A factory manager claims that workers at plant A are faster than those at plant B. To test the claim, a random sample of times (in minutes) taken to complete a given task was taken from each of the plant ...

Assignment - statistics in educational researchpart a -

Assignment - Statistics in Educational Research Part A - Show all your work Q1) A teacher asked each of her students how many novels they had read in the previous six months. The results are shown below. 0 1 5 4 2 1 3 2 ...

Business analytics and statistics research report -this

Business Analytics and Statistics Research Report - This assignment is based on fictional data. You are creating a business report for the CEO of a retail company called, Athlete Panda. It must be professional in present ...

Applied statistics homework project -download the data

Applied Statistics Homework Project - Download the data twoGenes.sav from the Week Four content area of brightspace. Each row represents data from a different sample of yeast RNA expression. The data represent the log2 f ...

Question 1 for the prostate data set fit a model with lpsa

Question 1. For the prostate data set, fit a model with lpsa as the response, and the other variables as predictors. (a) Suppose a new patient with the following values arrives: lcavol = 1.45000, lweight = 3.59801, age = ...

Linear project instructions -curve-fitting project - linear

Linear Project instructions - Curve-fitting Project - Linear Model For this assignment, collect data exhibiting a relatively linear trend, find the line of best fit plot the data and the line, interpret the slope, and us ...

A company produces labeled packaging material and the

A company produces labeled packaging material and the company intends to buy a new machine for shaping and labeling. The company has been approached by two different companies and the production manager did a test on the ...

What are the uses of the chi-square test in terms of data

What are the uses of the chi-square test in terms of data analysis for quality, safety, and patient safety? Provide two specific examples of when a HIM professional would use chi-square and why.

Using minitab to construct linear regression modelsscatter

Using Minitab to Construct Linear Regression Models Scatter Plot To obtain a simple scatter plot using Minitab: One of the first steps in the analysis of the study data is to create a scatter plot that compares the quant ...

  • 4,153,160 Questions Asked
  • 13,132 Experts
  • 2,558,936 Questions Answered

Ask Experts for help!!

Looking for Assignment Help?

Start excelling in your Courses, Get help with Assignment

Write us your full requirement for evaluation and you will receive response within 20 minutes turnaround time.

Ask Now Help with Problems, Get a Best Answer

Why might a bank avoid the use of interest rate swaps even

Why might a bank avoid the use of interest rate swaps, even when the institution is exposed to significant interest rate

Describe the difference between zero coupon bonds and

Describe the difference between zero coupon bonds and coupon bonds. Under what conditions will a coupon bond sell at a p

Compute the present value of an annuity of 880 per year

Compute the present value of an annuity of $ 880 per year for 16 years, given a discount rate of 6 percent per annum. As

Compute the present value of an 1150 payment made in ten

Compute the present value of an $1,150 payment made in ten years when the discount rate is 12 percent. (Do not round int

Compute the present value of an annuity of 699 per year

Compute the present value of an annuity of $ 699 per year for 19 years, given a discount rate of 6 percent per annum. As