Ask Statistics and Probability Expert

Detection and Estimation Theory

Project1

Hypothesis Testing Applied to Segregating A and B Students in a Detection and Estimation Course

An instructor wants to determine which of his students are A students and which are B students (this is a graduate course, so clearly all the students are either A or B students). The instructor gives a test to make this determination. This test contains 5 problems each worth 20 points. Both the A and B students will miss problems due to silly errors, incomplete knowledge (nobody is perfect), and time pressure (running out of time). The probability mass functions for the A and B students (single problem) are given below. Note that these probability mass functions are piecewise linear (this should help in getting the numbers.)

742_Hypothesis Testing_1.jpg

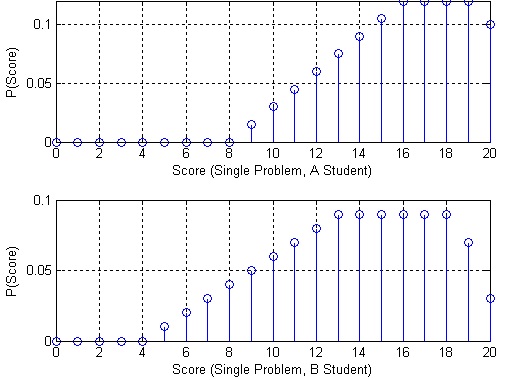
1. Given the total test score, generate a hypothesis test to minimize the probability of error supposing that 60% of the students are B students and 40% are students. For your hypothesis test, find out the probability that the instructor gives a student an A (student is segregated in the A group) if he deserves a B. Compute the probability that the instructor provides a student a B if he deserves an A.

2. You will require the density function for test scores for both A and B students to be capable to derive your hypothesis test. You must verify that you have the correct results through simulating the system and approximating the probabilities via statistics. You must also verify your probabilities of giving the student the wrong grade via your simulation. Note that the probability of a given score is approximated:  p (score) = # with score/total #

3. Some of you are probably saying: “What happens if we are all a students!!!” You are thinking that it is unfair to ascribe a priori that only 40% of the students are a students. We can avoid this a priori assumption by using the minimax test. Generate a minimax hypothesis test to segregate the students in A and B students. For the minimax hypothesis test, find out the probability that the instructor provides a student an A (student is segregated into the A group) if he deserves a B. find out the probability that the instructor gives a student a B if he deserves an A.

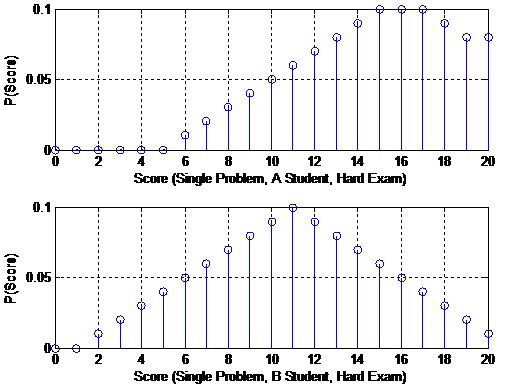
4. What occurs if the instructor gives harder problems? In this case, suppose the source probabilities in 1. Now, the probability mass functions for the A and B students (single problem) are given below. Note that these probability mass functions are again piecewise linear. Additional, the probability mass function for the A students is the same as the previous probability mass function for the B students. Create a hypothesis test for this case. For this test, find out the probability that the instructor gives a student an A (student is segregated in the A group) if he deserves a B. Compute the probability that the instructor gives a student a B if he deserves an A.

2006_Hypothesis Testing_2.jpg

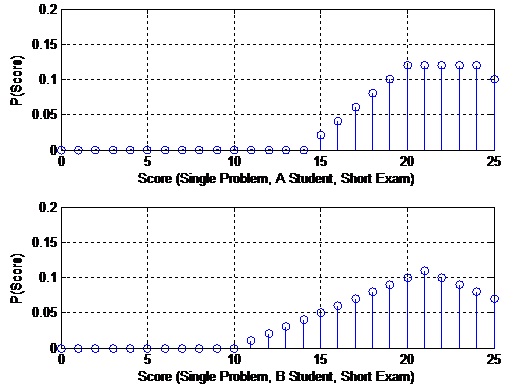
5. What occurs if the instructor gives a shorter test? In this case, suppose that there are four problems, each problem is worth 25 points, and the source probabilities are as given in 1. Also suppose that due to less time pressure, students do better on these problems. The probability mass functions for the A and B students (single problem) are given below. Note that these probability mass functions are again piecewise linear. Create a hypothesis test for this case. For this test, find out the probability that the instructor gives a student an A (student is segregated into the A group) if he deserves a B. find out the probability that the instructor gives a student a B if he deserves an A.

659_Hypothesis Testing_3.jpg

Hand in:

1. An explanation of the hypothesis tests (must be four) with the derivation of relevant results. The probabilities of giving an A to a B student, and giving a B to an A student for each test must be included. Create a table of these probabilities for easy comparison.

2. Make sure to comprise enough equations and verbage (but it does not have to be long) so that I can follow what you did and verify that you did it correctly.

3. The information of your simulation program with enough documentation to be easily understood. Comprise the data indicating that your probabilities are correct. Note you only have to simulate the first case, but you can use your simulation to confirm the other cases if desired.

Statistics and Probability, Statistics

  • Category:- Statistics and Probability
  • Reference No.:- M91169
  • Price:- $80

Guranteed 48 Hours Delivery, In Price:- $80

Have any Question?


Related Questions in Statistics and Probability

Introduction to epidemiology assignment -assignment should

Introduction to Epidemiology Assignment - Assignment should be typed, with adequate space left between questions. Read the following paper, and answer the questions below: Sundquist K., Qvist J. Johansson SE., Sundquist ...

Question 1 many high school students take the ap tests in

Question 1. Many high school students take the AP tests in different subject areas. In 2007, of the 144,796 students who took the biology exam 84,199 of them were female. In that same year,of the 211,693 students who too ...

Basic statisticsactivity 1define the following terms1

BASIC STATISTICS Activity 1 Define the following terms: 1. Statistics 2. Descriptive Statistics 3. Inferential Statistics 4. Population 5. Sample 6. Quantitative Data 7. Discrete Variable 8. Continuous Variable 9. Qualit ...

Question 1below you are given the examination scores of 20

Question 1 Below you are given the examination scores of 20 students (data set also provided in accompanying MS Excel file). 52 99 92 86 84 63 72 76 95 88 92 58 65 79 80 90 75 74 56 99 a. Construct a frequency distributi ...

Question 1 assume you have noted the following prices for

Question: 1. Assume you have noted the following prices for paperback books and the number of pages that each book contains. Develop a least-squares estimated regression line. i. Compute the coefficient of determination ...

Question 1 a sample of 81 account balances of a credit

Question 1: A sample of 81 account balances of a credit company showed an average balance of $1,200 with a standard deviation of $126. 1. Formulate the hypotheses that can be used to determine whether the mean of all acc ...

5 of females smoke cigarettes what is the probability that

5% of females smoke cigarettes. What is the probability that the proportion of smokers in a sample of 865 females would be greater than 3%

Armstrong faber produces a standard number-two pencil

Armstrong Faber produces a standard number-two pencil called Ultra-Lite. The demand for Ultra-Lite has been fairly stable over the past ten years. On average, Armstrong Faber has sold 457,000 pencils each year. Furthermo ...

Sppose a and b are collectively exhaustive in addition pa

Suppose A and B are collectively exhaustive. In addition, P(A) = 0.2 and P(B) = 0.8. Suppose C and D are both mutually exclusive and collectively exhaustive. Further, P(C|A) = 0.7 and P(D|B) = 0.5. What are P(C) and P(D) ...

The time to complete 1 construction project for company a

The time to complete 1 construction project for company A is exponentially distributed with a mean of 1 year. Therefore: (a) What is the probability that a project will be finished in one and half years? (b) What is the ...

  • 4,153,160 Questions Asked
  • 13,132 Experts
  • 2,558,936 Questions Answered

Ask Experts for help!!

Looking for Assignment Help?

Start excelling in your Courses, Get help with Assignment

Write us your full requirement for evaluation and you will receive response within 20 minutes turnaround time.

Ask Now Help with Problems, Get a Best Answer

Why might a bank avoid the use of interest rate swaps even

Why might a bank avoid the use of interest rate swaps, even when the institution is exposed to significant interest rate

Describe the difference between zero coupon bonds and

Describe the difference between zero coupon bonds and coupon bonds. Under what conditions will a coupon bond sell at a p

Compute the present value of an annuity of 880 per year

Compute the present value of an annuity of $ 880 per year for 16 years, given a discount rate of 6 percent per annum. As

Compute the present value of an 1150 payment made in ten

Compute the present value of an $1,150 payment made in ten years when the discount rate is 12 percent. (Do not round int

Compute the present value of an annuity of 699 per year

Compute the present value of an annuity of $ 699 per year for 19 years, given a discount rate of 6 percent per annum. As