+61-413 786 465
[email protected]
Home >> Statistics and Probability
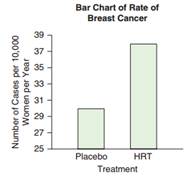
Hormone Replacement Therapy Again The bar chart shows a comparison of breast cancer rates for those who took HRT and those who took a placebo.
Explain why the graph is deceptive, and indicate what could be done to make it less so.
Statistics and Probability, Statistics
Introduction to Epidemiology Assignment - Assignment should be typed, with adequate space left between questions. Read the following paper, and answer the questions below: Sundquist K., Qvist J. Johansson SE., Sundquist ...
Question 1. Many high school students take the AP tests in different subject areas. In 2007, of the 144,796 students who took the biology exam 84,199 of them were female. In that same year,of the 211,693 students who too ...
BASIC STATISTICS Activity 1 Define the following terms: 1. Statistics 2. Descriptive Statistics 3. Inferential Statistics 4. Population 5. Sample 6. Quantitative Data 7. Discrete Variable 8. Continuous Variable 9. Qualit ...
Question 1 Below you are given the examination scores of 20 students (data set also provided in accompanying MS Excel file). 52 99 92 86 84 63 72 76 95 88 92 58 65 79 80 90 75 74 56 99 a. Construct a frequency distributi ...
Question: 1. Assume you have noted the following prices for paperback books and the number of pages that each book contains. Develop a least-squares estimated regression line. i. Compute the coefficient of determination ...
Question 1: A sample of 81 account balances of a credit company showed an average balance of $1,200 with a standard deviation of $126. 1. Formulate the hypotheses that can be used to determine whether the mean of all acc ...
5% of females smoke cigarettes. What is the probability that the proportion of smokers in a sample of 865 females would be greater than 3%
Armstrong Faber produces a standard number-two pencil called Ultra-Lite. The demand for Ultra-Lite has been fairly stable over the past ten years. On average, Armstrong Faber has sold 457,000 pencils each year. Furthermo ...
Suppose A and B are collectively exhaustive. In addition, P(A) = 0.2 and P(B) = 0.8. Suppose C and D are both mutually exclusive and collectively exhaustive. Further, P(C|A) = 0.7 and P(D|B) = 0.5. What are P(C) and P(D) ...
The time to complete 1 construction project for company A is exponentially distributed with a mean of 1 year. Therefore: (a) What is the probability that a project will be finished in one and half years? (b) What is the ...
Start excelling in your Courses, Get help with Assignment Write us your full requirement for evaluation and you will receive response within 20 minutes turnaround time.
Why might a bank avoid the use of interest rate swaps, even when the institution is exposed to significant interest rate
Describe the difference between zero coupon bonds and coupon bonds. Under what conditions will a coupon bond sell at a p
Compute the present value of an annuity of $ 880 per year for 16 years, given a discount rate of 6 percent per annum. As
Compute the present value of an $1,150 payment made in ten years when the discount rate is 12 percent. (Do not round int
Compute the present value of an annuity of $ 699 per year for 19 years, given a discount rate of 6 percent per annum. As