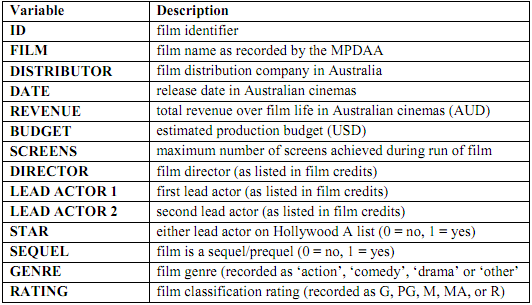
Harvey Weinstein has employed you as a consultant to brief him on film performance in the Australian cinema industry over the years 1997-2007. You have obtained some data on film revenues and associated variables from the Motion Picture Distributors Association of Australia (MPDAA). The file ‘Film data.xls' contains data on the top 100 films at the Australian box office for each of the years 1997-2007. However, due to some missing data (on budget) the sample is reduced and only includes 992 films with complete information. The following table provides descriptions of the data provided in the ‘Film data.xls' file:
a) To get a sense of the data, provide two well labeled scatter-plots of 1) revenue vs. budget, and 2) revenue vs. screens. Also, provide a correlation matrix of these three variables
b) After speaking to an industry expert, they tell you that budget and screens are the most important determinants of film success at the box office (advertising is important too, the expert tells you, but you don't have data on that). Produce a regression with ‘revenue' as the dependent variable and ‘budget' and ‘screens' as the independent variables. Interpret the regression coefficients.
c) With your regression results of part b), provide residual plots vs. each independent variable. Also, provide a histogram of the (standardised) residuals. Comment on the nature of the residuals based upon these three plots.
d) You show your results and plots to your econometrics professor at university and he tells you that you may have an issue with non-normal errors caused by outliers. He suggests you transform the revenue, screens, and budget data into natural logarithms and re-estimate the equation, which you do. Provide results of the new regression and interpret the regression coefficients [Hint: d lnY/d lnX = (dY/dX)*(X/Y) = (dY/Y)/(dX/X)].
e) With your new regression results of part d), provide residual plots vs. each independent variable. Also, provide a histogram of the (standardised) residuals. Comment on the nature of the new residuals based upon these three plots.
f) You discuss the results with the industry expert again. They tell you that apart from screens and budget, films with A-list stars and films which are sequels generally earn more at the box office. Therefore you decide to include these dummy variables in your updated model from part d). Are these new variables individually significant in the updated model? Do their coefficients' signs support the expert's intuition?
g) You are about to prepare your final report when an old friend calls you on the phone. You tell your friend about the project because they go to film school and you suspect they might find it interesting. Your friend wonders whether genre and rating might be important as well. You have data on these variables but need to construct some more dummy variables. Treating ‘Other' and ‘G' as the base categories for ‘genre' and ‘rating', respectively; estimate the new model and provide a partial-F test to test whether the extra variables are worthwhile adding assuming 5% level of significance.
h) You decide to present the model you estimated in f) to Harvey. You ring him on the phone to request a meeting and let him know that you've completed the work. He asks one more request of you: to provide a point estimate of revenue for a film he is planning on releasing in Australian cinemas soon. The film has a budget of $200,000,000, will release on a maximum of 250 screen, features an A list actor, and is also a sequel. Calculate the prediction of how much revenue this film might earn given this information (Hint: be mindful of the (natural) log transformations you have made).
i) Before the final meeting with Harvey, you remember from your ECMT1010 course that it would be better to provide an estimate of the average value of revenue (for the given values of the independent variables) by presenting a confidence interval for the conditional mean (recall equation 13.12 in Black 2E/3E). Because you've been paying close attention in class, you realise the confidence intervals computed by KaddStat are not the ones you are after and the equation you learnt in ECMT1010 is only suitable for simple regression, and not multiple regression.
You pay another visit to your econometrics professor who is rushing out the door on the way to the faculty Christmas party. He knows you've been learning some matrix algebra so scribbles you down an equation in matrix form for the confidence interval for the conditional mean:
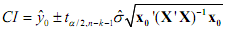
Where y^o = point prediction of revenue (which you found in part h); t α/2,n-k-1 = the t-value for a two tailed test with level of significance α and n-k-1 degrees freedom; σ^ is the estimated standard error of the estimate;
x0 is the (5x1) vector of values for the independent variables (i.e. the four given by Harvey - and the constant term); and X is the (992x5) matrix of all observations for the independent variables (including the constant).
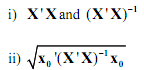
Using the matrix multiplication (MMULT) and matrix inverse (MINV) functions in Excel, provide the following:
iii) What are the upper and lower bounds of a 95% confidence interval for expected revenue in Australian dollars?
Attachment:- Film-data.xls