Graduate level organized and scientific and statically sound solutions to be presented Follow all hints and specifications
The project is to use R to analyze a dataset from options provided at the end. And write a affective and scientifically and statically sound and organized report. The report needs to be a graduate level of critical thinking reflection and well organized. "Zero plagiarism". The report should reflect an higher level of understanding in all means - programming, scientifically, statistically.
4 pages for written single-spaced text with solid backgrounds, strong critical thinking in terms of what answers you want to find for the strong questions you will be asking from the data to find(remember based on the questions you ask your critical thinking will be analyzed asking merely simple questions will not meet the criteria. The questions should be of graduate level critical hypothesis clearly stated followed by how can you get reply to the question you posed and why you think this question is important what important applicable information will it give and how the information will be applicable and useful scientifically and statistically sound discussion and complete interpretation of results, and general to specific conclusions. (Always also include P-values but don't limit yourself to only p values all the discussion should be complete and thorough and in appropriate English and scientific language)
(***Hint for report to follow by students start with a generalized overall big hypothesis or question like finding the patterns in the whole set of data generate a picture-
followed by getting in to more specific questions from the overall pattern to specific hypothesis and pattern which would look like
later add the omplexity of layers of information in one picture to extract more info- it would look like-
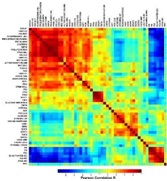
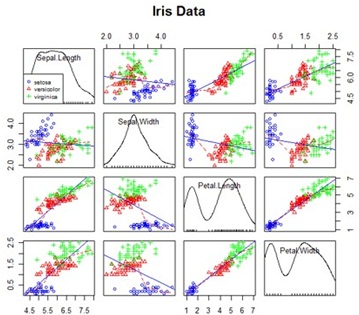
More than 7 advanced figures should be included following the 4 pages of text. The figures generated should be like publishable pictures for paper. They need to be visually appealing ( using basic colors will cut down points use of advanced color such as forest green, antique white etc us recommended the trick is you can select advanced plate and make figures but it will not help you with good grade the purpose is for you to make your own Palate with advanced colors and generate publishable pictures) For example see the picture below.( however you should also include appropriate readable title and labels for each picture of yours in addition )
This picture above is incomplete you need to take it as an example and complete the pic with titles and labels.
In this above figure the flaw is you don't want to have that grey part so you need to develop a one with out it for triangle maps also colors are easy and straight conveying the message but these are not an own made advance color palate.
So an complete full picture of what this assignment want you to produce and this pictures below its requirment as part of five pictures you will generate for the report others you can pick of choice but meeting the criteria specified already-

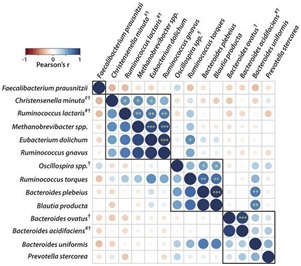
See for the details there are yellow stars on some bubbles two starts for p<0.05 starts for p<0.01 You also need to mention the detail under this picture about what stars indicate.
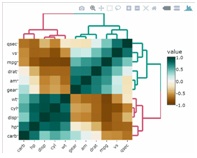
2. Picture you need to produce this.
3. You need to include this
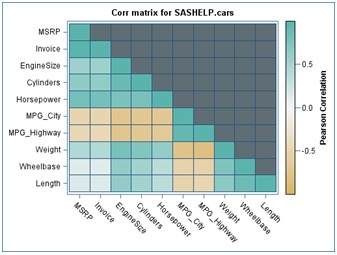
3. You need to produce this but use advanced color palate of your own and make sure labels are clear and readable.
You can also generate a figure like this.
Below each figure explain what information is conveyed by each picture in complete. ALL the labels, axis, titles and reader scales should be clearly readable. Basic colors should not be used for any figure. The reader scale should be clear visible, complete , not overlapping on picture.
Figures required are below- You must add any other which are reflection of complex yet appealing demonstration.
References to sources of information or data should be included in text and at the end of report. Follow APA format for references. R code later organize the stepwise-command lines followed by command description should be included as appendix.
Data sets for projects: You can choose one from below data options for the project but do mention a little bit about which one you selected in report.
1. 2. 100 interesting datasets: http://rs.io/100-interesting-data-sets-for-statistics
2. A link to many datasets. At http://www.statsci.org/datasets.html
3. Other datasets at UCI data repository https://archive.ics.uci.edu/ml/index.html
4. Investigate weather data to see global trends in climate http://graphical.weather.gov/xml/
http://www.ncdc.noaa.gov/data-access/quick-links