problem 1: A bottling company has determined the number of machine breakdowns per month and their respective probabilities as shown below:
Number of Breakdowns Probability
0 0.12
1 0.38
2 0.25
3 0.18
4 0.07
Which of the following answers gives the expected number of machine breakdowns per month? describe your answer.
a) 2
b) 1.70
c) the outcome with the highest probability
d) at least 4
problem 2: Indicate which of the following are cross-section data, giving your reasons.
a) Wages of individual workers in the UK chemical industry in 2009.
b) Annual growth rates of each of the European economies in 2009.
c) The annual growth rate of the European chemical industry, 1999-2009.
problem 3: A random sample of visitors to a National Park were interviewed regarding their impressions of the Park. Of 200 interviewees, 120 said that they would probably make a return visit within 12 months.
a) The National Park is aiming to achieve a target of two-thirds of visitors returning within a year. Perform a test to assess whether the sample results support the view that this target is being reached.
b) Within the sample, 100 interviewees had visited the National Parkon a weekday and had average expenditure of £10.00 with standard deviation £5.00, whilst 100 had visited on a weekend and had average expenditure of £12.50 with standard deviation £4.00.
Test the hypothesis that average expenditure on a weekend is greater than on a weekday, by calculating a relevant P-value, and describe your findings.
problem 4:
a) For a certain population it is required to test the hypothesis H0: μ = 200 against the alternative H1: μ> 200. It is known that the population standard deviation is 22.
i) If a sample of size 200 is selected and yields X‾ = 202.5, what is the P-value for this test?
Using a 5% significance level, what conclusion would be drawn from the test?
ii) If the test is performed using a 5% significance level, what is the critical value of X‾ for this test?
b) Without performing any calculations, describe what difference it would make to the conduct of the test if the sample was only of size 20.
problem 5:
a)
i) describe what is measured by a correlation coefficient.
ii) Why do economists generally find regression a more useful tool than correlation?
iii) In a sample of 102 men the correlation between age and monthly donations to charity is found to be 0.2.
Test whether this correlation is significantly different from zero and comment on your result.
b) describe with the aid of diagrams the difference between type 1 and type 2 errors in hypothesis testing. Which, if any, of these errors may have been made in your answer to (a)(iii) above?
c) For a multiple regression with three explanatory variables the value of R2 is 0.75.
Indicate whether each of the following statements is true or false and give brief reasons for your answer:
i) The three explanatory variables each describe 25% of the variation in the dependent variable.
ii) If R2 = 0.75 then three quarters of the data is perfectly describeed by the model.
iii) The most important factor when comparing this model with any others is to find the highest R2.
iv) The higher the value of R2, the greater the probability the model is correct.
d) describe the difference between the usual (product moment) correlation and rank correlation. In what situations is it more appropriate to use rank correlation?
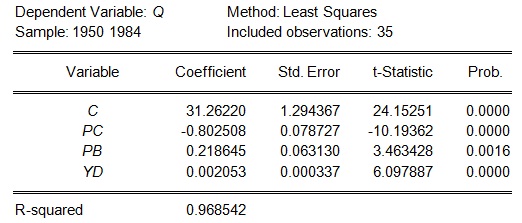
problem 6: The following multiple regression results are part of a study of the demand for chicken in the USA. Q measures the quantity of chicken purchased per annum. PC and PB are the price of chicken and beef respectively and YD is disposable income. C is the intercept term in the equation
a)
i) describe briefly whether you would expect each of the slope coefficients to be positive or negative, giving your reasons.
Hence comment on the signs of the sample estimates.
ii) What further information would be required in addition to the information given in the table to estimate the price or income elasticity of demand. describe your answer.
iii) Show that all of the estimated coefficients are significantly different from zero at the 5% significance level.
b) Taking account both of economic theory and of the results obtained so far, discuss what changes might be made to improve the model.
problem 7: A sample of data on 60 individuals in 2007 yielded the following information where X is disposable income and Y is saving.
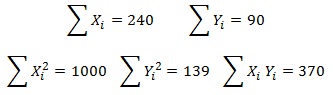
a) Show that in the relationship
Yi = α + βXi + εi
where εi is a disturbance (error) term, the OLS estimates of α and β are 0.5 and 0.25 respectively.
b) Give economic interpretations of α and β, and hence discuss whether the signs on the sample estimates accord with your expectation.
c) Evaluate the total sum of squares (TSS) and the regression sum of squares (RSS), and use these to assess the goodness of fit of the model.
d) Test the hypothesis that the population slope coefficient is 0.2 against a two-tail alternative and describe your conclusions.
e) describe how would you interpret the coefficient β if instead of the model in (a) the sample data were used to estimate
log(Yi)= α+ β log(Xi) + εi