Q1) Find out a plausible value r for correlation between vehicle weight and miles per gallon (mpg) shown in the scattergram below?
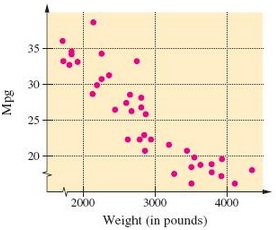
a) r = -0.1
b) r = -0.9
c) r = -1.0
d) r = 1.0
e) r = 0.8
Q2) Following chart illustrates hours studied by 10 students and their grades on examination. If student studied for 9 hours, about what grade would you expect her to make?
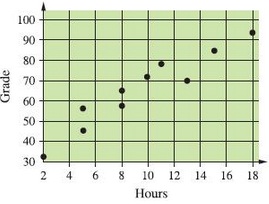
a) 65
b) 50
c) 80
d) 95
e) 45