Ask Question, Ask an Expert

+61-413 786 465

info@mywordsolution.com

Ask Applied Statistics Expert

Do we experience emotions differently? Do people from different cultures experience emotions differently? One study designed to examine this question collected data from 416 college students from five different cultures. The participants were asked to record, on a 1 (never) to 7 (always) scale, how much of the time they typically felt eight specific emotions. These were averaged to produce the global emotion score for each participant. Here is a summary of this measure:

661_Tab 06.jpg

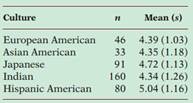
Note that the convention of giving the standard deviations in parentheses after the means saves a great deal of space in a table such as this.

(a) From the information given, do you think that we need to be concerned that a possible lack of Normality in the data will invalidate the conclusions that we might draw using ANOVA to analyze the data? Give reasons for your answer.

(b) Is it reasonable to use a pooled standard deviation for these data? Why or why not?

(c) The ANOVA F statistic was reported as 5.69. Give the degrees of freedom and either an approximate (from a table) or an exact (from software) P-value. Sketch a picture of the F distribution that illustrates the P-value. What do you conclude?

(d) Without doing any additional formal analysis, describe the pattern in the means that appears to be responsible for your conclusion in part (c). Are there pairs of means that are quite similar?

Applied Statistics, Statistics

  • Category:- Applied Statistics
  • Reference No.:- M92239435

Have any Question?


Related Questions in Applied Statistics

Question 1 for the prostate data set fit a model with lpsa

Question 1. For the prostate data set, fit a model with lpsa as the response, and the other variables as predictors. (a) Suppose a new patient with the following values arrives: lcavol = 1.45000, lweight = 3.59801, age = ...

Using minitab to construct linear regression modelsscatter

Using Minitab to Construct Linear Regression Models Scatter Plot To obtain a simple scatter plot using Minitab: One of the first steps in the analysis of the study data is to create a scatter plot that compares the quant ...

Business analytics and statistics research report

Business Analytics and Statistics Research Report Assignment - This assignment is based on fictional data - do not contact the company listed below. You are creating a business report for the CEO of a retail company call ...

Exercise -q1 do the example data in table 35-2 meet the

Exercise - Q1. Do the example data in Table 35-2 meet the assumptions for the Pearson χ 2 test? Provide a rationale for your answer. Q2. Compute the χ 2 test. What is the χ 2 value? Q3. Is the χ 2 significant at α = 0.05 ...

Using minitab statistics to calculate the various

Using Minitab Statistics to calculate the various T-Tests The steps required for completing the deliverables for this assignment (screen shots that correspond to these instructions can be found immediately following them ...

Question onea a factory manager claims that workers at

QUESTION ONE (a) A factory manager claims that workers at plant A are faster than those at plant B. To test the claim, a random sample of times (in minutes) taken to complete a given task was taken from each of the plant ...

Statistics for business decisions assignment assignment 1

Statistics for Business Decisions Assignment Assignment 1 - QUESTION 1 - Time Series Regression The table below presents the number of students attending Statistics lectures in weeks 1 to 10. Week Number of students 1 90 ...

Assignment -in this assignment ms excel must be used to

Assignment - In this assignment MS Excel must be used to perform any calculations/graphical presentations as required in this assignment. Question 1 - Below you are given the examination scores of 20 students (data set a ...

As the him member of your research team you are preparing

As the HIM member of your research team, you are preparing for a clinical trial study involving human subjects. The research would track two possible mutually exclusive outcomes, such as survive/did not survive, yes/no, ...

Applied statistics homework project -download the data

Applied Statistics Homework Project - Download the data twoGenes.sav from the Week Four content area of brightspace. Each row represents data from a different sample of yeast RNA expression. The data represent the log2 f ...

  • 4,153,160 Questions Asked
  • 13,132 Experts
  • 2,558,936 Questions Answered

Ask Experts for help!!

Looking for Assignment Help?

Start excelling in your Courses, Get help with Assignment

Write us your full requirement for evaluation and you will receive response within 20 minutes turnaround time.

Ask Now Help with Problems, Get a Best Answer

Why might a bank avoid the use of interest rate swaps even

Why might a bank avoid the use of interest rate swaps, even when the institution is exposed to significant interest rate

Describe the difference between zero coupon bonds and

Describe the difference between zero coupon bonds and coupon bonds. Under what conditions will a coupon bond sell at a p

Compute the present value of an annuity of 880 per year

Compute the present value of an annuity of $ 880 per year for 16 years, given a discount rate of 6 percent per annum. As

Compute the present value of an 1150 payment made in ten

Compute the present value of an $1,150 payment made in ten years when the discount rate is 12 percent. (Do not round int

Compute the present value of an annuity of 699 per year

Compute the present value of an annuity of $ 699 per year for 19 years, given a discount rate of 6 percent per annum. As