1) In the search box type in the ticker of the company choice or the name of the company. Find your company click on it to take you to the company's info.
2) On the left side you will see Historical Prices. Click on it.
3) No change daily to monthly. Also change the start date enter, Jan, 1, 2009. Then click Get Prices.
4) Now you see the monthly prices. At the bottom of the data, it will give you the option to download it to Download to Spreadsheet. When you download it to spread sheet it will be in CVS format. Save it in Excel. The data contains many columns, so keep the DATE (first column) and Adj Close ( last column). Save as your last name. keep it open.
5) Now repeat 1-6 with some modifications. This time download S&P 500 (Standard and Poor 500 top companies average stock index). For the ticker for sp500 type in ^GSPC. Then again click on Historical Prices on the left; choose monthly; for the date enter Jan 1, 2009; download to spreadsheet; keep first column and last column. Now highlight the date and data column and copy and paste it next to the data you have for your company.
6) Now you have 4 columns: Date, adj close; Date, and Adj Close. Delete the Date column. Rename the first Adj Close to your company's name (in my case APPLE) and the second Adj Close as SP500. Save.
7) Sort the data from the jan 2009 to jun 2014. Here is the snapshot of my data:
|
Date
|
APPLE
|
SP500
|
|
1/2/2009
|
12.31
|
825.88
|
|
2/2/2009
|
12.19
|
735.09
|
|
3/2/2009
|
14.35
|
797.87
|
|
4/1/2009
|
17.18
|
872.81
|
|
5/1/2009
|
18.54
|
919.14
|
|
6/1/2009
|
19.45
|
919.32
|
Just for the sake of easiness, make sure put sp500 first and then apple stock price:
|
Date
|
SP500
|
APPLE
|
|
1/2/2009
|
825.88
|
12.31
|
|
2/2/2009
|
735.09
|
12.19
|
|
3/2/2009
|
797.87
|
14.35
|
|
4/1/2009
|
872.81
|
17.18
|
|
5/1/2009
|
919.14
|
18.54
|
|
6/1/2009
|
919.32
|
19.45
|
|
7/1/2009
|
987.48
|
22.31
|
|
8/3/2009
|
1020.62
|
22.97
|
8) Now concert them to returns. In column D type in Rsp500 in column E type Rcompany. Then go to D3 cell and type =(B3-B2)/B2*100. Use copy paste to the end of data. Then in E3 type =(C3-C2)/C2*100 and then copy paste to the end of data. Here is the snapshot of my data:
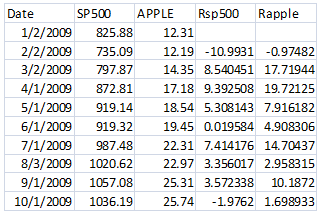
Note that these are return in percentage. For example between Jan to Feb months, apple dropped by about 1% (-0.974) while SP500 (market) dropped by almost 11% (10.993). Then the next month apple rose by 17.72% while market rose by only 8.54%.
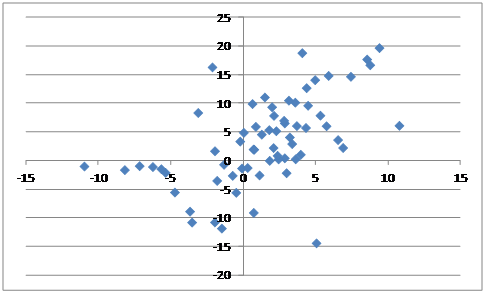
10) Now the fun begins. Highlight D3:E67. Then go to Insert on the Excel Ribbon. Then choose Scatter and under scatter choose the first graph. This is called scattered diagram o Y (apple return) against X (sp500 return). Here is my graph:
11) Now add the heading: such as Monthly Apple's Stock Returns to SP500 Returns. For the Y-axis write Rapple and for X-axis write Rsp500. This graph shows the relationship between stock movement top market movements. As it is seen there is an upward trend. It appears apple's return moves with the market. The slope of a line passing through these points is called the beta-risk of apple stock. There are several ways to find that slope. The easiest is right click on one of the points on the graph. Then choose Add Trendline. When dialog box opens check boxes: Display Equation on chart and Display R-squared value on chart. Here is my graph:
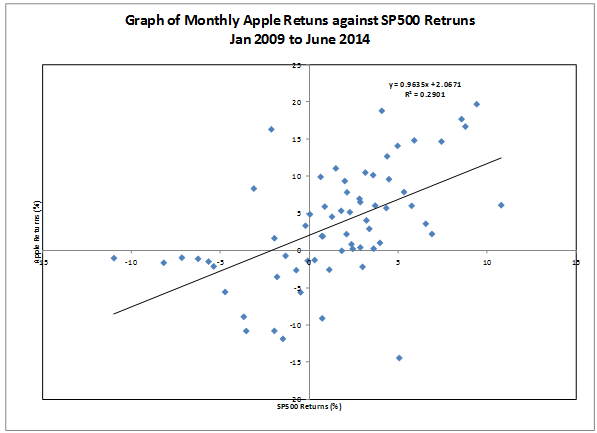
Beta risk of apple relative to market is 0.9631 (SLOPE OF THE LINE). This means when market rises by 1% (or 10%), apple stock rises by 0.9631% (or 9.631%) and when market drops by 1% (or 10%) then apple stock drops by 0.9631 (or 9.631%). This shows apple is less risky than market (beta<1 but almost close to 1). Apple is less sensitive relative to market but not by much. it looks apple is moves very closely relative to the market.
NOTE: Movements in market returns can explain only 29% (R-squared) of the movements in the apple returns. There possibly are other factors than market that can explain more of the variability in apple' returns. However, this is one of the techniques used to calculate the riskiness of a stock and is widely used despite of its short comings. This is the topic under security market line under capital asset pricing model. And the line drawn above is called characteristic line which is the a proxy for the true line based on statistical or better to say regression analysis.
12) Now go back to finance.yahoo.com and type your company's ticker. On the left click on Key Statistics. Then look the last column on the right and find the beta calculated by yahoo. For my apple it is 0.74 whereas my calculation came up with 0.96. That is yahoo shows that apple is even less sensitive than my calculation. The reason for this discrepancy is that although they use the same approach, however, they use some cleaning of the data before calculating the slope. You should not be concerned with that. Just mention in your write up what Yahoo's number is and interpret it too.
13) YOUR JOB IS TO DO WHAT I HAVE DONE ABOVE ON A COMPANY OF YOUR CHOICE. THEN COPY AND PASTE IT ON WORD AND ANALYZE YOUR COMPANY'S BETA RISK. CONSULT YOUR BOOK FOR MORE DETAIL. DO NOT CHOOSE APPLE.