1. Consider the following scenario for object recognition with two types of objects, A and B where the ultimate goal is to build a system that can recognize which of the two object types is present in front of a camera. To recognize the objects we make observations of 5 different properties of the objects, shape, color, size, texture, and labeling. Here we measure shape as either round or square, color as red or blue, size as small, medium, or large, texture as uniform or striped, and labeling as labeled or unlabeled.
Making observations of the two object types, we find the following:
Of all the objects, 70% are of type A and 30% of type B. 80% of objects of type A are large, 10% are medium, and 10% are small. Also, 40% are red while 60% are blue.Of objects of type B, 30% are large, 50% are medium, and 20% are small. Similarly, 80% are red while 20% are blue. For both object types there is no dependence between their size and their color. Of all the the small objects, 75% are round while of the medium objects only 35% are round and only 10% of the large objects. The texture depends on the color and the size , where the probability of a uniform texture is 30% for small and red objects, 10% for small and blue objects, 75% for medium and red objects, 40% for medium and blue objects, 90% for large and red objects, and 60% for large and blue objects. The likelihood of labeling on the objects is related to the texture and the shape. In particular, 80% of all square and uniform objects, 40% of the round and uniform objects, 30% of all square and striped objects, and 10% of all round and striped objects have labeling.
a) Construct a Bayesian Network for the object recognition scenario that encodes the information we have about the objects (you can assume that only the direct dependencies listed above are present). Provide the structure of the network as well as the conditional probability tables.
b) To perform object recognition with the network we would set the observations that we made and then infer the conditional probability of the different object types. Derive the probability of object type A given that we observe that the object is unlabeled, small, and red. Similarly, derive the probability of object type A given that we can observe that the object is striped, and large.
c) Using the network we can also infer properties of the objects that we could not observe before.
Infer the probability of an object being labeled given that it is blue and round. Also compute the prior probability of an object being labeled.
d) Bayesian Networks are not unique and can be rearranged into a different structure that nevertheless represents the same joint probability distribution. For the network in a), build an equivalent network in which the node for object type is a leaf node. In particular, build a network with the node order shape, color, size, texture, labeling, type, where the order indicates that only nodes earlier in the list can be parents to nodes later in the list. You should derive both the new structure and the new conditional probability tables.
2. Being able to generate samples from a particular distribution is an important ability to develop simulations and to evaluate algorithms. While most computers are equipped with random number generators to generate numbers from a uniform distribution, generators for other distributions have to be created. Often this can be done using the uniform random number generator.
a) Research has shown that the total number of (latent) disk errors on a hard drive (when drives without any errors are excluded) behaves approximately like a Pareto distribution ,
with a scale parameter, xm = 1 and a shape parameter, α, which depends on the particular type of hard drive. The Pareto distribution has the following probability density function:
α xαm x> xm
p(x:α,xm) = { xα+1
0 otherwise
For a disk with α = 0.5, construct and implement a random number generator that gen-erates samples according to this distribution using the system's built-in uniform random number generator. Describe the derivation of the random number generator.
b) Use the random number generator from part a) to generate a simulation that generates samples for the number of errors that a hard drive will encounter. Generate 400 samples and plot a histogram for the resulting distribution. Also use the samples to compute the expected number of errors that we would expect for a hard drive.
3. Monte-Carlo simulations can also be used to perform inference in Bayesian networks. Consider the following Bayesian network:
R : P (R | O ∧ T S) = 0.2
P(R | O ∧ ¬T S) = 0.4
P(R | ¬O ∧ T S) = 0.5
P(R | ¬O ∧ ¬T S) = 0.8
Indoors Large City Weather Forecast
(I) (C) (W)
Concrete Obstacles Thunderstorm
(O) (TS)
Strong Reception
(R)
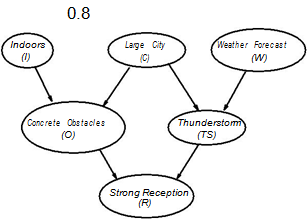
O : P (O | I ∧ C) = 0.7
P (O | I ∧ ¬C) = 0.4
P (O | ¬I ∧ C) = 0.5
P (O | ¬I ∧ ¬C) = 0.1
T S : P (T S | C ∧ W ) = 0.6
P (T S | C ∧ ¬W ) = 0.05
P (T S | ¬C ∧ W ) = 0.5
P (T S | ¬C ∧ ¬W ) = 0.1 I : P (I) = 0.6
C : P (C) = 0.7
W : P (W ) = 0.2
a) Implement sampling from an empty network to compute P (I ∧C ∧O∧W ∧T S ∧R). Print out the sampling-based estimate as well as the difference between the result of sampling and the actual probability for 20, 100, 200, and 400 samples.
b) Implement likelihood weighted sampling to compute P (T S|C, R, I). Again, show the results and the error for 20, 100, 200, and 400 samples.
4. Monte-Carlo simulations can be used to solve expected value problems.
a) Implement random sampling from the exponential distribution and use Monte-Carlo simulation to compute the mean, variance and skewness of the exponential distribution with λ = 0.5.
Show your estimates after 10, 50, and 100 samples.
b) Use Monte-Carlo simulation to visualize the central limit theorem by simulating the distribution of the means from the exponential and uniform distribution. In particular, for each of these original distributions sample averages over 5, 15, and 30 samples by drawing the corresponding number of samples and computing their average. Repeat this 100 times and plot the histograms of the resulting distributions of the means.
5. Confidence intervals can be used to indicate the variation in data as well as to determine how many different random simulations are necessary to ensure that the simulation error is within given bounds with high probability.
a) Given the following sample set: {2, 5, 3, 4, 3, 4, 2, 3, 4}, compute its average and the corresponding 95% confidence interval.
b) To bound the expected relative error that the simulation (i.e. the specific data set) introduces on the results of a given experiment, we want to determine the number of simulations we should run. For this, we first run 30 experiments, leading to data with a mean of 4.5 and a standard deviation of 2. Determine whether this data already provides an expected relative error introduced by the simulation of below 5%. If not, compute how many new simulations you should run in order to reduce the expected relative error introduced by the simulation below 5%.