Q1) You are given the following data.
|
x
|
y
|
|
2
|
14
|
|
3
|
9
|
|
4
|
11
|
|
5
|
11
|
|
5
|
10
|
|
7
|
5
|
|
7
|
4
|
Determine:
a) SS(x)
b) SS(y)
c) SS(xy)
d) Linear correlation coefficient, r
e) The slope b1
f) The y-intercept, b0
g) The equation of the line of best fit.
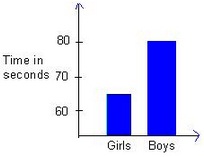
2) Bar graph below compares mean time in seconds for 7-yr old girls to complete certain task to mean time in seconds for 7-yr old boys to complete same task. There is statistical deception here. Explain what is deceptive about bar graph.