Q1) Use graph below that illustrates average number of weekly viewers of 30-minute television program (in millions of viewers) from 2000 to 2006.
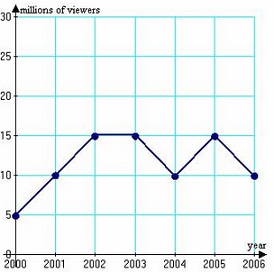
Determine change in average number of weekly viewers from to
a) -10 million
b) no change
c) -5 million
d) 5 million
e) 10 million
Q2) Is line is good representative of the data?
a) Yes
b) No
Q3) The heights of certain species of plant are normally distributed, with mean cm and standard deviation cm. Determine probability that plant selected at random will be will be between and cm tall?
a) 0.9876
b) 0.4938
c) 0.9938
d) 0.0062
e) 0.5062